GAMUT Quality Metrics Presentation and Database Development
The presentation by Linda A. Meiner covers the history and development of GAMUT Quality Metrics, including benchmarking database creation and updating process. It delves into data collection methods and reporting, showcasing achievements and future goals in the air medical transport sector.

Download Presentation

Please find below an Image/Link to download the presentation.
The content on the website is provided AS IS for your information and personal use only. It may not be sold, licensed, or shared on other websites without obtaining consent from the author. If you encounter any issues during the download, it is possible that the publisher has removed the file from their server.
You are allowed to download the files provided on this website for personal or commercial use, subject to the condition that they are used lawfully. All files are the property of their respective owners.
The content on the website is provided AS IS for your information and personal use only. It may not be sold, licensed, or shared on other websites without obtaining consent from the author.
E N D
Presentation Transcript
GAMUT Database Internationally Benchmarked Quality Metrics Presentation to CAMTS Board 10/13/17 LINDA A MEINER, MSN, RNC LINDA A MEINER, MSN, RNC- -NIC, NE NIC, NE- -BC BC CLINICAL MANAGER CLINICAL MANAGER SITE SURVEYOR SITE SURVEYOR PHI AIR MEDICAL LLC PHI AIR MEDICAL LLC CAMTS CAMTS
Goals for this presentation. Review the history of the development of the GAMUT Quality Metrics Discuss the development of a benchmarking database using REDCap software Identify the method to register for participation in the database Demonstrate the method of reporting to the database Discuss methods used to collect quality data for submission and share lessons learned Review the process underway for updating the GAMUT Quality Metrics Review current GAMUT data for selected metrics
Transport Quality Metrics Selected and Defined Birthplace June 2011 - Ohio - 6 Neonatal and Pediatric Teams collaborated to: Identify transport quality metrics 23 metrics Develop common definitions for each metric Ohio specialty teams begin collecting and comparing data on the metrics
Transport Quality Metrics Defined Expansion of neo-peds metrics October 2012 - AAP-Society of Transport Medicine Quality Metrics Summit held to: Review the Ohio metrics to decide their application outside of Ohio Validated the metrics using a Delphi ranking technique Identified and ranked 12 must have metrics Neo-Peds teams outside of Ohio began to use these metrics for internal reports
Transport Quality Metrics Defined Expansion to adult transport metrics . July 2013 Air Medical Physicians Association Quality Metric Summit held to: Select adult and general transport metrics using the same Delphi methodology Selected, defined and ranked 22 quality metrics Some overlap with the AAP metrics Some transport programs began using these metrics to look at their own performance trends
GAMUT Database The BIG Step Forward Ground and Air Medical QUality Transport Database created in January 2014 Collaborative effort to use benchmarking to drive improvement Name choice - Metrics run the gamut Drs. Mike Bigham and Howard Schwartz (Ohio Peds) led the project supported by AMPA and Rollie Parrish (Flight Nurse-IT Wiz) Selected REDCap software for data collection Data site hosted on the AMPA website/server Open to all types of transport programs Semi annual reports blinded to participating programs
GAMUT Database The Vision To facilitate medical transport programs of all types collaborating to improve the quality of care they deliver. Establishing strict definitions for quality metrics that are agreed- upon, important, reliable, relevant and feasible to data gather. Developing a database and the infrastructure for programs to track, report, and analyze their performance by comparing it to other programs. Identifying practices used by the high performing transport teams for each of the metrics and widespread adaptation of these best practices across participating programs.
GAMUT Identity/Resources Logo designed Website www.gamutqi.org Overview Metric definitions FAQ s Join Us Register to get started About Us REDCap Login link for data managers
GAMUT Developmental Milestones January 2015 January 2016 January 2017 1st birthday Age 2 years old 3 years old # of participating programs 260 100 150 105 established # of patient encounters with data entered Over 100,000 140,242 in 2015 449,749 in 2016 Dashboards and M2M run charts (real time) ABC Achievable Benchmark of Care Consensus metrics revision started Oversight Committee focusing on improving the report product Dashboards and M2M Run Charts Oversight Committee appointed (AMPA, AAP-SOTM and stakeholders) Activities Initiating steps to gain Nat l Quality Foundation endorsement for quality metrics In process, one or two at a time Little progress
GAMUT Supporters Currently no charge to programs for participation Efforts supported by: AMPA AAP-SOTM MedEvac Foundation Laerdal Foundation Akron Children s Foundation Cincinnati Children s Foundation On-going funding a current topic
Reporting to GAMUT Select one Data Manager for a Program, register via the website Identify the metrics to be measured and reported can be all or some CAMTS Standards define choice of metrics by Level of Care Utilize the REDCap Login to enter data monthly
Reporting to GAMUT Dashboard tracks your data entry progress
Reporting to GAMUT Data Entry The easy part once you have your data!
Collecting the Data PHI Experience Challenges and our response Data entry errors pick list errors IT assist with data collection - programming added auto logic where appropriate, additional training, data integrity challenges Data entry errors reviewers drift from definitions or apply personal biases to answers selected Training program for reviewers Data entry audits by Clinical Manager and return of questionable responses for validation Glucose if ALOC? many false Yes s reeducate reviewers Internal arguments re the selected GAMUT metrics and definitions Should we include each metric? - Just start somewhere! Commitment to follow the GAMUT definitions and work with GAMUT Steering Committee on problematic metrics
Collecting the Data PHI Experience Challenges and our response Believing the data That can t be right validation and follow up How do we know others are truthful? compare ourselves with our history and internally, data will improve over time Cross checks with parallel reporting systems If data show a med error, was a QA report completed and if a QA report was filed with a med error was it captured in our data? Find the most reliable source i.e., OCC Health Team injuries, RM - Sentinel Events First year majority of efforts focused on data collection and integrity, some improvements seen Now able to focus on process improvement
GAMUT Definitions - Example v.05/16/2016
Program Definitions - Example Airway Management and Ventilation If PHI intubation using RSI were all elements of PHI RSI guideline followed? Yes No N/A Eff 1/1/2015
Expanded Definitions - Example Airway Management and Ventilation If PHI intubation using RSI were all elements of PHI RSI guideline followed? Select Yes if there is documentation of: Documentation of a LEMON - difficult airway assessment Standard NC at 15L/m in place t/o procedure (with allowable exclusions for age) Sedation and paralysis according to Guideline Drug doses consistent with Guideline Both pre and post procedure pulse oximetry readings documented Select No if missing required elements or if there are deviations from the Guideline explain in Comments Select N/A if no RSI Eff 3/1/2017
GAMUT Semi-annual Report 1 of 3 elements for each metric
GAMUT Semi-annual Report 2 of 3 elements for each metric
GAMUT Semi-annual Report 2 of 3 elements for each metric
GAMUT Semi-annual Report 3 of 3 elements for each metric
GAMUT Website Improvements M2M Benchmarking and ABC available in real time for each metric updates as data is entered
GAMUT Improvements Monthly Run Charts Simple QI tool that adds visibility to your improvement efforts Involves minimal math to determine statistical significance Easily identifies signals establishes a new median Establish a baseline with 5-6 points Shift 6 or more consecutive points either above or below the median Trend 5 or more consecutive points all going up or down Run identifies a non-random pattern too few or too many Astronomical point - one point very different from others Reference on later slide Achievable Benchmarks of Care (ABC) Establishes the performance level consistently being attained by the best participants that account for at least 10% of the overall population adjusts for Programs with low denominators
GAMUT Metric Revision Project - 2017 Goal keep metrics relevant change as practices change Using NQF requirements for metrics Round 1 concluded 4/17/17 Call for new metrics Round 2 Voting begins late 2017 Vote on candidate metrics (newly proposed plus items pulled from lit search and other consensus care standards) Look for items with consensus (high or low importance) Identify equivocal metrics Clarification of existing metrics Removal of unused/underreported metrics Round 3 Focused on metrics in equivocal group Round 4 if necessary
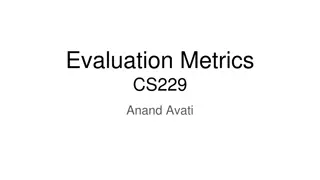
GAMUTs First QI Collaborative Project Global AIM The global aim for this initiative is that by March 1, 2018, GAMUT s monthly percentage of pediatric patient transport contacts with advanced airways in whom continuous waveform capnography is used will be equal to or greater than 50% for neonates and 95% for pediatric patients from 42% and 91% currently.
GAMUTs First QI Collaborative Project September 2017-March 2018 Monthly Webinars Education of QI Methodology (SMART Aim, KDD, Process Maps, Run Chart, FMEA, Pareto Charts) Breakout group facilitated sessions (individual progress/homework) Group Summary Following Institute for Healthcare Improvement s approach and tools MOC for MD s involved 16 programs participating
GAMUT Database Report Highlights BASED ON JUL16 BASED ON JUL16- -JUN17 GAMUT DATA JUN17 GAMUT DATA RECEIVED SEPT 2017 RECEIVED SEPT 2017
Ventilator Utilization Pts with adv airway supported by mechanical ventilator 100.0% 98.0% 96.0% 100.0% 100.0% 94.0% 99.4% 98.0% 92.0% 95.3% 92.5% 90.0% 88.0% Adult (N=26270) Peds (N=5322) Neo (N=3486) GAMUT Rate ABC
Waveform Capnography Use Patients with adv airway 100.0% 90.0% 80.0% 70.0% 60.0% 100.0% 100.0% 50.0% 98.2% 97.9% 88.1% 40.0% 30.0% 40.8% 20.0% 10.0% 0.0% Adult (N=26326) Peds (N=5163) Neo (N=3085) GAMUT Rate ABC
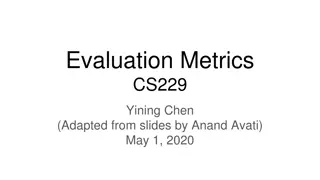
1st Attempt Intubation Success 100.0% 90.0% 80.0% 70.0% 60.0% 100.0% 50.0% 97.6% 88.5% 82.1% 40.0% 75.6% 62.7% 30.0% 20.0% 10.0% 0.0% Adult (N=6299) Peds (N=868) Neo (N=834) GAMUT Rate ABC
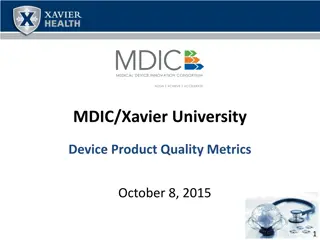
DASH1A Definitive airway sans hypoxia or hypotension on the 1st attempt 100.0% 90.0% 80.0% 70.0% 60.0% 50.0% 98.5% 95.3% 92.2% 40.0% 74.1% 67.4% 30.0% 54.2% 20.0% 10.0% 0.0% Adult (N=6152) Peds (N=798) Neo (N=649) GAMUT Rate ABC
Thank you Dr Mike Bigham and Dr Howard Schwartz, Rollie Parrish for their pioneering efforts AAP SOTM and AMPA for supporting this quality improvement effort All the early adopters who exercised their data collection muscles, reported their data and learned the hard way, started over and contributed to the early successes CAMTS for adding this to Standards
References GAMUT information website - http://gamutqi.org/ - includes the Metric list and definitions Quality Metrics in Neonatal and Pediatric Critical Care Transport: A Consensus Statement. Pediatr Crit Care Med 2013; 14:518-524. Measure, Report, Improve: The Quest for Best Practices for High-Quality Care in Critical Care Transport. Clinical Pediatric Emergency Medicine, 2013 Sept; 14(3):171-79. Quality Metrics in Neonatal and Pediatric Critical Care Transport: A National Delphi Project. Schwartz HP, Bigham MT, Schoettker PJ, Meyer K, Trautman MS, Insoft RM; American Academy of Pediatrics Section on Transport Medicine. Pediatr Crit Care Med. 2015 Oct;16(8):711-7. Intubation in Pediatric/Neonatal Critical Care Transport: National Performance. Bigelow AM, Gothard MD, Schwartz HP, Bigham MT. Prehosp Emerg Care. 2015 Jul-Sep;19(3):351-7. Perla, R. J., Provost, L. P., & Murray, S. K. (2011). The run chart: A simple analytical tool for learning from variation in healthcare processes. BMJ Quality & Safety, 20(1), 46-51.