Gary's Grub and Gasoline Business Analysis
Explore the strategic analysis of Gary's Grub and Gasoline coaching slides from California State University, Northridge BUS 302 course. Dive into basic facts, pricing strategies, data interpretation, consumer price index insights, and real profit analysis. Discover how to plot real profits over time, analyze changes, and estimate demand curves for fuel and meal sales using regression analysis. Uncover the importance of using real prices for accurate calculations and decision-making.
Download Presentation

Please find below an Image/Link to download the presentation.
The content on the website is provided AS IS for your information and personal use only. It may not be sold, licensed, or shared on other websites without obtaining consent from the author. If you encounter any issues during the download, it is possible that the publisher has removed the file from their server.
You are allowed to download the files provided on this website for personal or commercial use, subject to the condition that they are used lawfully. All files are the property of their respective owners.
The content on the website is provided AS IS for your information and personal use only. It may not be sold, licensed, or shared on other websites without obtaining consent from the author.
E N D
Presentation Transcript
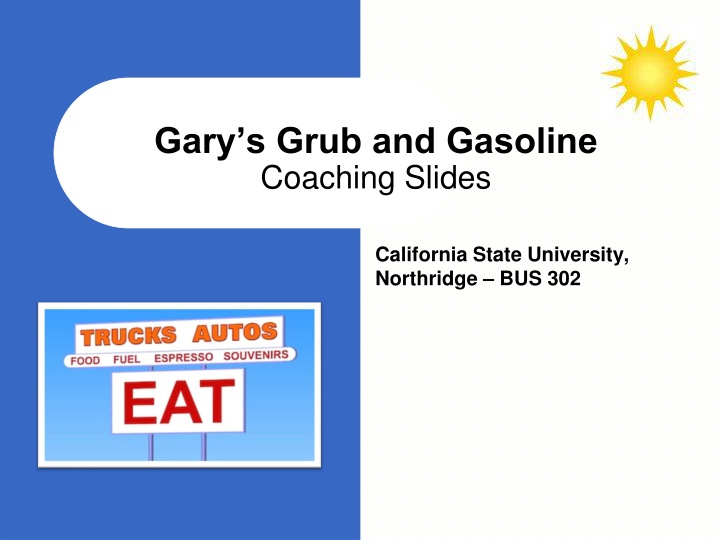
Garys Grub and Gasoline Coaching Slides California State University, Northridge BUS 302
Basic Facts Basic Products Diesel (truckers) Gasoline (tourists - seasonal) Meals Activities Can Relate to Each Other E.g. Lower gas prices can bring in more meals sold. Why?
Basic Facts Pricing Diesel: Typically marked up 1 cent per gallon Gasoline: Typically marked up 1.5 cents per gallon Meals: Average ticket = $12.55
Data The data spreadsheet file Gary's Service Station and Diner - Student Data Spreadsheet.xlsx is available in the Case Material section of the BUS 302 website. Most numbers in spreadsheet given are in nominal terms (not adjusted for inflation) Some numbers are real and are already adjusted for inflation. The column heading will contain the word real .
Consumer Price Index (CPI) In the data spreadsheet there is a column with the heading CPI. This stands for consumer price index and is different for every year. The US Bureau of Labor Statistics chooses a past year as a base year, say the year 2010, which would have an arbitrary CPI of 1.0 or 100%. The price of a basket of goods in another given year, say 2011, is expressed as a percentage of the price of a basket in the base year and this would be the CPI for the given year.
Consumer Price Index (CPI) A CPI of 1.05 or 105% for say 2011 means that prices have risen 5% since the base year, say 2010. To convert a nominal price to a real, inflation adjusted price, you simply divide by the CPI. In our example a $10.00 nominal price in 2011 would be a real price of $10.00/1.05 or approximately $9.52 in base year (2010) dollars. Be sure to use real dollars in all of you calculations for prices.
Questions 1 & 2: Real Profits Question 1 Real Profits over Time. Plot a scatter diagram of the real profits over time. You can find instructions in the PowerPoint Using Excel for Statistics in the Case Material section of the BUS 302 website. Question 2 Change in Real Profits See Using Excel for Statistics to perform a simple regression. You can use the t statistic or p-value to test for significance. Let significance ( ) be .05. The independent variable is time.
Question 3: Demand Curves To estimate fuel and meal sales demand, perform three simple regressions. Be sure to use real prices for meals, gas, and diesel fuel. The dependent variable (Y) is the variable you wish to predict. The independent variable (X) is the variable you wish to base your prediction on. Test for significance: Let significance be .05.
Question 4: Elasticities The price elasticity of demand measures how consumers respond, through quantity demanded, to a price change. Is the estimate you will make for the firm or for the market? To find the elasticities for gas, diesel, and meals you can use you can use the appropriate slope of the regression line in Question 3 multiplied by the mean (average) real price. Then divide by the mean quantity demanded. If your elasticity is negative, make it positive. Be sure to interpret your three elasticities.
Question 5: Profit How do additional fuel (gas and diesel) sales add to profits? How do additional meal sales add to profits?
Question 6 - Recommendations What do you recommend Gary s should do? What is going well? What can be improved? How should they price? Gasoline pricing? Diesel pricing? Meals Other considerations


