Gas Channels Workshop and Active Regulation Studies
Gas Channels Workshop held at the Office of Naval Research and Department of Physiology & Biophysics in September 2012 in Cleveland, Ohio. The workshop included discussions on gas selectivity by channels and active regulation of pH levels in squid giant axons. Computer simulations and physiological significance were explored through various experiments and examples presented by experts in the field.

Download Presentation

Please find below an Image/Link to download the presentation.
The content on the website is provided AS IS for your information and personal use only. It may not be sold, licensed, or shared on other websites without obtaining consent from the author. If you encounter any issues during the download, it is possible that the publisher has removed the file from their server.
You are allowed to download the files provided on this website for personal or commercial use, subject to the condition that they are used lawfully. All files are the property of their respective owners.
The content on the website is provided AS IS for your information and personal use only. It may not be sold, licensed, or shared on other websites without obtaining consent from the author.
E N D
Presentation Transcript
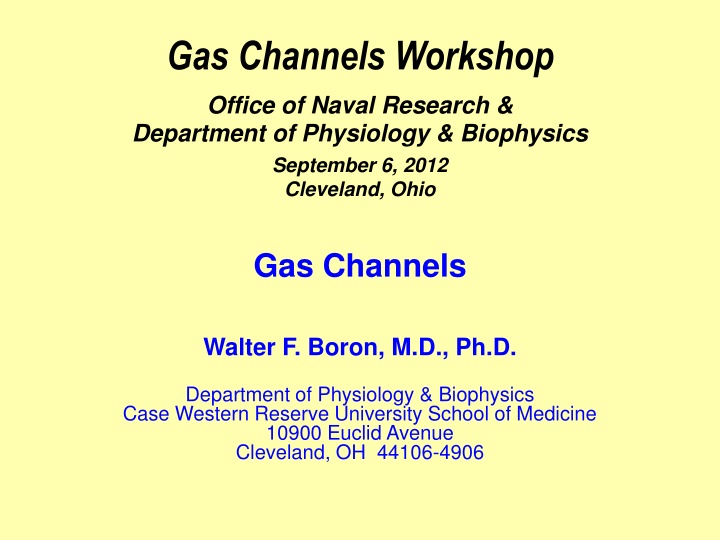
Gas Channels Workshop Office of Naval Research & Department of Physiology & Biophysics September 6, 2012 Cleveland, Ohio Gas Channels Walter F. Boron, M.D., Ph.D. Department of Physiology & Biophysics Case Western Reserve University School of Medicine 10900 Euclid Avenue Cleveland, OH 44106-4906
Outline Background Computer simulations Gas selectivity by channels Physiological significance
Introduction of the CO2Pulse (squid giant axon) 5% CO2 / 50mM HCO3 7.4 pHi 7.2 + H2O+ CO2 CO2 H2O 7.0 + H++ H+ HCO3 HCO3 6.8 10 min -56 -58 Boron & De Weer, J Gen Physiol 67, 1976 Paul De Weer
Introduction of the CO2Pulse (squid giant axon) CO2 H2O+ CO2 pHi + H2O 5% CO2 / 50mM HCO3 HCO3 H+ + 7.4 H++ HCO3 Energy 7.2 7.0 6.8 10 min -56 -58 Boron & De Weer, J Gen Physiol 67, 1976
First Example of Active Regulation of pHi (squid giant axon) 5% CO2 / 50mM HCO3 7.4 7.2 7.0 6.8 10 min -56 -58 Boron & De Weer, J Gen Physiol 67, 1976
NDCBE First Example of Active Regulation of pHi CO2 pHi Na+ CO3= (squid giant axon) pHi Cl #1 #2 5% CO2 / 50mM HCO3 Na-Driven Cl-HCO3 Exchanger 7.4 7.2 #1 7.0 #2 6.8 10 min -56 -58 Roger C. Thomas John M. Russell Boron & De Weer, J Gen Physiol 67, 1976
The Ammonium Prepulse (squid giant axon) 10 mM NH4Cl 7.8 pHi pHi + 7.6 H++ NH3 NH3 H+ 7.4 pHi 7.2 NH4+ NH4+ NH4+ 15 min 7.0 -58 -62 Boron & De Weer, J Gen Physiol 67, 1976
The Ammonium Prepulse (squid giant axon) 10 mM NH4Cl 10 mM NH4Cl 7.8 7.6 7.4 pHi 7.2 pHi 15 min + H+ 7.0 NH3 H++ NH3 -58 -62 NH4+ NH4+ Boron & De Weer, J Gen Physiol 67, 1976
The Dogma inspired by the work of Overton more than a century ago All gases move through all membranes simply by dissolving in the membrane lipid.
Gas diffusion through a membrane #1 #2 #3 #4 Solubility theory P sL/sW Overton s rule Overton (1897) JK Mitchell (1831) Solubility- Diffusion theory P (sL/sW) D T Graham (1866) Access Solubility Diffusion Egress This how gases cross artificial membranes and some biological membranes but not all D Access-Solubility- Diffusion-Egress theory P (A/E) (sL/sW) D Boron (2010) [X]W = sW pX [X]L = sL pX Henry s Law
When would a gas channel make physiological sense? * Fick s Law: JX = PX([X]o [X]i) #1 #3 #1 Background permeability is low #2 Gradient is low #3 Physiological demand is high (unstirred layers cannot overwhelm membrane ) #2 D * A gas channel could: (1) enhance flux if PX is low, (2) display selectivity for a particular gas, or [X]o [X]i (3) be under physiological regulation (4) Be amenable to pharmacological intervention *Includes access, s, D, egress *In mammals, ULs are tiny in high-flux systems *An absolute sine qua non
Molecular Anatomy of a Trafficking Organelle Note that the model accounts for approximately 2/3 of the protein mass of [synaptic vesicles]. WFB: This model does not include the soluble proteins that bind to the vesicle It can be envisioned that, viewed from the outside, the lipidic surface is hardly visible when all [integral membrane] proteins are present further limiting access of dissolved gases such as CO2. Takamori Jahn, Cell 127, 2006
Gas Channels Workshop We will hear more about permeability barriers from Volker Endeward and this will be a subject of discussion tomorrow
Gas Channels Workshop We will hear more about the regulation of permeability to water and gases from Bhanu Jena
The First Gas-Impermeable Membrane Collection Side Perfusion Side CO2 Endocrine Cell Parietal Cell Chief Cell Luminal Change Basolateral Changes 100% CO2 pH 6.1 1% CO2 pH 7.4 5% CO2 pH 7.4 7.4 7.2 pHi 7.0 Parietal Cell 5 min Waisbren et al, Nature 368, 1994 6.8
Xenopus-Oocyte Expression System pH Vm CO2 CO2 cRNA ? 3 days Expressed AQP1 cRNA
Effect of AQP1 Expression on CO2 Permeability The First Gas Channel CO2 / HCO3- 7.3 pHi/ t x10-4 pH/s Ooze Time(s) 180 -9.6 pHi 7.2 82 -25.1 10 sec 50 -35.8 7.1 Cooper & Boron, AJP Cell 275, 1998 Nakhoul et al, AJP Cell 274, 1998
Outline Background Computer simulations Gas selectivity by channels Physiological significance
Technical Approach Molecular Dynamics (MD) simulations Start with crystal structure and interatomic forces Calculate vibrational movements of atoms, every 1 fs in real time for a total of ~10 ns
AQP1 Structure (top view) Central pore: Mainly hydrophobic ~3 A at narrowest Gated by hydrophobic residues Aquapore: Hydrophilic & hydrophobic Length: 18 20 A Diameter: 2.8 4 A at narrowest (near bilayer center) Sui et al, Nature 414, 2001
Molecular Dynamics Simulation: CO2 through the Central Pore of AQP1 CO2 Wang et al, J Struct Biol 157, 2007 Emad Tajkhorshid
Running Conclusions O2 and CO2movement through AQP1 is feasible both via the aquapores and the central pore The central pore (a ~vacuum) may be the perfect channel for nonpolar gases
Gas Channels Workshop We will hear more about Molecular Dynamics modeling from Emad Tajkhorshid
Gas Channels Workshop We will hear more about the structural biology of proteins that act as gas channels from Bob Stroud
Outline Background Computer simulations Gas selectivity by channels Physiological significance
Technical Approach Express mammalian channels in Xenopus (frog) oocytes. Study dissolved gases that change pH Measure pH on the surface of the oocyte using pH-sensitive microelectrodes
Xenopus oocyte: pH Changes Caused by CO2 Influx 5% CO2 33 mM HCO3 7.7 AQP1 pHS 7.5 H2O H2O [CO2]S H+ 2 min CO2 CO2 CO2 HCO3 H2O pHi HCO3 H+ [HCO3 ] pHS HCO3 pH with 15- m tip Bulk Extracellular Fluid Musa-Aziz et al, PNAS, 2009
Xenopus oocyte: pH Changes Caused by NH3 Influx 7.7 0.5 mM NH3 + NH4+ H2O pHS7.5 AQP1 [NH3]S H+ 2 min 7.3 NH3 NH3 H+ pHS NH3 NH4+ pHi NH4+ NH4+ [NH4+] pH with 15- m tip Bulk Extracellular Fluid Musa-Aziz et al, PNAS, 2009
d Free Diffusion CO2 CO2 CO2 CO2 H2O H2O H2O H2O H2O H2O H2O H2O Bulk Extracellular Fluid (BECF) k k k k k+ k+ k+ k+ 1 1 1 1 1 1 1 1 H2CO3 H2CO3 H2CO3 H2CO3 k k k k k+ k+ k+ k+ 2 2 2 2 2 2 2 2 HCO3- + HCO3- + H+ HCO3- + HCO3- + H+ Intracellular Fluid (ICF) H+ H+ + + + + A A A A k + k + k + k + k+ + k+ + k+ + k+ + ( ) 2 ( ) 2 ( ) 2 ( ) 2 ( ) 2 ( ) 2 ( ) 2 ( ) 2 HA HA HA HA Extracellular Unconvected Fluid (EUF) Somersalo, Occhipinti, Boron, Calvetti, J Theor Biol, 2012
(A) (C) 7.508 M,CO P M,CO/10 P M,CO/10 P M,CO/10 P M,CO/10 P M,CO/ 2.5 10 P M,CO/5.0 10 P M,CO/7.5 10 P M,CO/10 P = 34.2 cm/sec 1 7.20 2 2 7.506 2 2 3 7.15 2 4 7.504 pHS 2 4 pHi 7.10 2 4 2 4 7.502 2 5 7.05 2 7.500 7.00 0 200 400 600 800 1000 1200 Time (sec) (B) 0 200 400 Time (sec) (D) 600 800 1000 1200 -3 -3 x10 x 10 8 3 6 ( pHS)max 2 4 -(dpHi/dt)max 1 2 0 0 10 -4 -2 0 2 -2 0 2 -4 10 10 PM,CO2(cm/sec) 10 10 10 10 10 Rossana Occhipinti PM,CO2(cm/sec)
Implications The background permeability of the membrane (i.e., in the absence of gas channels) must be very low. With additional refinements to the model, we ought to be able to be able to estimate absolute permeabilities.
Gas Channels Workshop We will hear more about the macroscopic modeling of CO2 influx into oocytes from Rossana Occhipinti, tomorrow morning
More Aquaporins Channel-specific H2O permeability (5) (5) 0.004 (4) 0.003 (7) (7) (7) (4) (6) Pf*(cm/s) 0.002 (14) 0.001 0.000 hAQP8 hAQP9 rAQP7 AQP1 AQP4 AQP0 AQP4 AQP2 AQP3 M23 M1 R. Ryan Geyer Raif Musa-Aziz Musa-Aziz, Geyer, Boron
More Aquaporins 0.08 Relative, channel-specific CO2 permeability (5) 0.06 (6) NS from zero NS from zero ( pHS*)CO2 0.04 (4) (13) (5) (11) (9) (12) (3) 0.02 0.00 hAQP8 hAQP9 rAQP4 rAQP7 rAQP4 hAQP1 hAQP2 rAQP3 AQP0 M23 M1 0.00 (6) (9) (13) (11) -0.02 NS from zero NS from zero NS from zero (5) ( pHS*)NH3 -0.04 (12) (3) (5) -0.06 Relative, channel-specific NH3 permeability (4) -0.08 Musa-Aziz, Geyer, Boron
Xenopus oocytes: CO2 over Pf or NH3 over Pf ( pHS*)CO2 Pf* ( pHS*)NH3 Pf* (10) (13) (13) 60 60 CO2 NH3 (17) 50 50 40 40 (10) 30 30 (6) (17) (9) (12)(17) (5) (13) 20 (13) 20 (5) 10 10 (17) (12)(12) (13) (13) (12)(12) (6) (9) (12) 0 0 AQP6N60G AQP4M23 AQP4M1 AQP6wt AQP2 AQP0 AQP1 AQP3 AQP5 AQP7 AQP8 AQP9
Xenopus oocytes: CO2over NH3 (17) (6) (13) (13) (10) 3 ( pHS*)CO2 ( pHS*)NH3 (5) 2 (17) (11) (12) 1 (11) (9) (12) 0 AQP6N60G AQP4M23 AQP4M1 AQP6wt AQP7 AQP1 AQP3 AQP0 AQP2 AQP8 AQP5 AQP9 Undefined (0/0) Musa-Aziz Boron, unpublished
More Rhesus Proteins: RhBG & RhCG 0.08 0.08 Relative, channel-specific CO2 permeability 0.06 0.06 (12) (12) Relative index of CO2/NH3 permeability CO2/NH3 permeability Relative index of (14) (14) ( pHS*)CO2 0.04 0.04 (8) (8) 1.0 1.0 (12) (12) 0.02 0.02 0.8 0.8 0.00 0.00 (14) (14) RhCG RhAG 0.6 0.6 RhBG ( pHS*)CO2 ( pHS*)NH3 ( pHS*)NH3 ( pHS*)CO2 0.00 0.00 (8) (8) 0.4 0.4 -0.02 -0.02 0.2 0.2 ( pHS*)NH3 -0.04 -0.04 0.0 0.0 RhCG RhAG RhBG -0.06 -0.06 (12) (12) -0.08 -0.08 (8) (8) (14) (14) Relative, channel-specific NH3 permeability Geyer, Toye, Boron, Musa-Aziz
Gas Channels Workshop We will hear more about the role of Rh proteins as NH3 channels from David Weiner
Question What is the molecular basis of gas selectivity?
AQP1 Structure (top view) Central pore: Hypothesis blocked by DIDS Aquapore: Blocked by HgCl2 and pCMBS Sui et al, Nature 414, 2001
H2O & NH3 Pathways through hAQP1 25% H2O & NH3 (blocked by pCMBS) = 100% 0% H2O and NH3 (DIDS has no effect)
CO2 Pathways through hAQP1 10% CO2 (blocked by pCMBS) = 40% ? 60% CO2 (blocked by DIDS) DIDS + pCMBS blocks ~100%


")


")


")