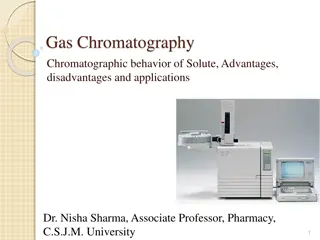
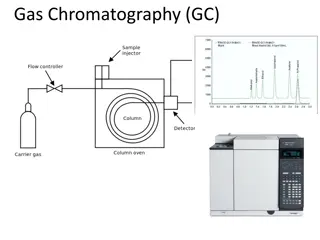
Explore the principles and applications of gas chromatography, including qualitative and quantitative analysis methods for identifying and quantifying compounds. Learn how retention time and volume are used for compound identification, and the importance of automatic integrators in quantitative analysis. Discover the role of spectrometry in final compound identification.
Please find below an Image/Link to download the presentation.
The content on the website is provided AS IS for your information and personal use only. It may not be sold, licensed, or shared on other websites without obtaining consent from the author. If you encounter any issues during the download, it is possible that the publisher has removed the file from their server.
You are allowed to download the files provided on this website for personal or commercial use, subject to the condition that they are used lawfully. All files are the property of their respective owners.
The content on the website is provided AS IS for your information and personal use only. It may not be sold, licensed, or shared on other websites without obtaining consent from the author.
E N D
Presentation Transcript
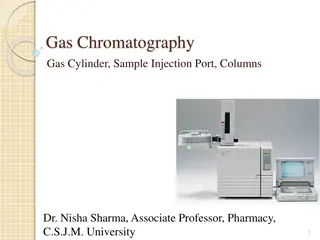
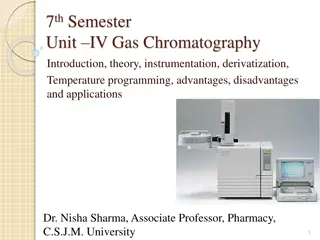
GAS CHROMATOGRAPHY Presented by Dr. Mrs. C. S. Patil Professor & Head Department of Chemistry Vice-Principal Deogiri College, Aurangabad
GAS CHROMATOGRAPHY GUIDED BY DR MRS CS PATIL MAM VICE PRINCIPAL OF DEOGIRI COLLEGE AURANGABAD
1) Qualitative analysis: The individual components of quantitative analysis of a Mixture may be obtained The comparing of the retention time or volume of the unknown to the retention time or volume of a series of standard. The components are collecting individual they appear from chromatography and subsequently identifying by other methods. All of exprimental parameters are used of retention time or volume especially the flow rate and temperature all the standard and unknown must be carefully controlled here many compound they have a same retention time the signal data are often for positive identification.
It has been found under a given experimental condition the log of the retention volume is a linear function Of the number of carbon atoms in each homologous series . A different line obtained for each different homologous series from showing these graph the number of carbon atoms may be determined of know series. Plot of retention Volume v/s number of carbon atoms for homologous series
A plot of retention volume on a polar column v/s retention volume on non- polar column may be used to determine the series to belongs compound The collected samples are final identification is usually made by spectroscopy, nuclear magnetic resonance or infrared absorption techniques. Plot of retention volume on a polar Plot of retention volume on a polar column v/s plot of retention volume column v/s plot of retention volume on a non on a non- -polar column polar column
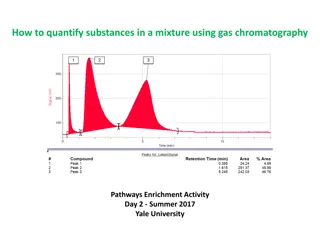
2) Quantitative analysis: Quantitative analysis of a chromatography which depends upon the fact that the area under single components elution peak is proportional to the quantity of the detect components. In order for any peak area measurement to meaningful, the output recorder must be linear with concentration and the time response of the recorder must either match the time response for the detector . An automatic integrators must be coupled directly to the detector. In addition the flow rate of carrier gas must constant in there order and allow a conversion between flow rate and time. Because the speed, accuracy and ease of interpretation of result, the automatic integrators are preferred. If no integrators are available to determine area by the cut and weigh procedure. the paper, thickness and moisture are must be constant content cut and weight components per weight of paper factor is determine.
The peak area also determined by triangulation procedure In this method tangent are drawn on the two sides of curve . The intercept of the two tangent with each other at the top of height H. The distance between the intercepts of the two tangent with baseline is width W . The area A is calculated by formula A=1/2 WH The triangulation method of determining peak area
The Response factor: None of the detector respond to the same degree for an equal mass of different compound , response factor must be determined for each pure compound under any given condition. This response factor is used to subsequent calculations for the quantitative evaluation of an unknown in a Mixture under same conditions. Graph and calibration: Rather than calculating response factor, a number of exact known weight of the known pure components may be chromatogramed. The concentration of the unknown is obtained from the standard plot of concentration against peak heights .
Internal standards: In this procedure the known weight of an internal standard is added to each of series of known samples weight. The internal standard must be similar in structrue to sample components and retention time of the standard and samples components must be close to each other but must be resolved from each other as well as samples components.
3) Miscellaneous Applications: Miscellaneous it is the large number of applications have been achieved by GLC. This applications is so large and not possible to cover them completely during the last few decades we have seen the rapidly changing complexities of the product ( eg: drug, foodstuffs ,consumer products) and the technology with the environmental problems. A few typical applications will be discussed as follows.
The detection of steroids drug used by athletes in international sports competition and the steroids administered to animals in traces are being carried out by GLC. Hazardous pollutants such as formaldehyde, carbon monoxide, trichloroethylene ,& benzene can be monitored by GLC. IN analysis of food, the separation and identification of lipids, proteins, carbohydrates colorants and texture modifiers as well as vitamins, steroids, drug and pesticides residue and traces elements are involved. As most of compound are non-volatile ,HPLC Is now used for food analysis but GLC is also frequently used by converting them into a volatile from suitable for separation. It is possible to analyse the dairy products by GLC for aldehydes and ketones, fatty acid by & milk sugar.
It is possible to use the pyrolysis GC for separation and identification of volatile materials like It is possible to use the pyrolysis GC for separation and identification of volatile materials like plastic, natural and synthetic polymers, paint and microbiological samples. The chromatograms plastic, natural and synthetic polymers, paint and microbiological samples. The chromatograms provide provide valuable information on the molecular structure from the identification of the pyrolysis product and valuable information on the molecular structure from the identification of the pyrolysis product and the chemical composition of the sample. the chemical composition of the sample. It is known that inorganic compounds are mostly non volatile. However they can be subjected to GC It is known that inorganic compounds are mostly non volatile. However they can be subjected to GC studies by derivatization into volatile compound. Some metal chloride and hydrides are inherently studies by derivatization into volatile compound. Some metal chloride and hydrides are inherently volatile. Some organometallics such as boranes ,germans organotin ,organic lead compound are volatile. Some organometallics such as boranes ,germans organotin ,organic lead compound are amenable for GLC separation. A number of metal chelates have been separated by GLC. amenable for GLC separation. A number of metal chelates have been separated by GLC. some examples of applications for GC for environmental studies include separation and some examples of applications for GC for environmental studies include separation and identification of identification of polycyclic aromatic hydrocarbons ,chlorinated pesticides polycyclic aromatic hydrocarbons ,chlorinated pesticides eg : (DDT, BHC) eg : (DDT, BHC)


 Qualitative analysis:")


 Quantitative analysis:")


 Miscellaneous Applications:")