Gauge R&R Analysis: Ensuring Measurement Accuracy for Informed Decision-Making
Learn how to use Gauge R&R analysis to quantify measurement error and ensure its acceptability before making critical business decisions. Discover the components of variation through ANOVA in EngineRoom for accurate analysis results.

Download Presentation

Please find below an Image/Link to download the presentation.
The content on the website is provided AS IS for your information and personal use only. It may not be sold, licensed, or shared on other websites without obtaining consent from the author. If you encounter any issues during the download, it is possible that the publisher has removed the file from their server.
You are allowed to download the files provided on this website for personal or commercial use, subject to the condition that they are used lawfully. All files are the property of their respective owners.
The content on the website is provided AS IS for your information and personal use only. It may not be sold, licensed, or shared on other websites without obtaining consent from the author.
E N D
Presentation Transcript
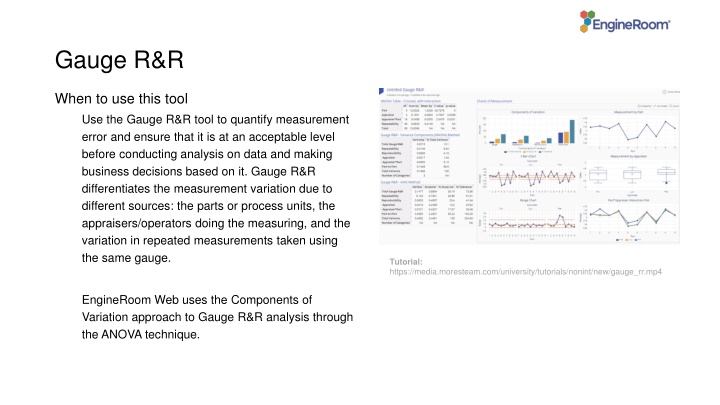
Gauge R&R A close up of a map When to use this tool Use the Gauge R&R tool to quantify measurement error and ensure that it is at an acceptable level before conducting analysis on data and making business decisions based on it. Gauge R&R differentiates the measurement variation due to different sources: the parts or process units, the appraisers/operators doing the measuring, and the variation in repeated measurements taken using the same gauge. Description automatically generated Tutorial: https://media.moresteam.com/university/tutorials/nonint/new/gauge_rr.mp4 Tutorial: https://media.moresteam.com/university/tutorials/nonint/new/gauge_rr.mp4 EngineRoom Web uses the Components of Variation approach to Gauge R&R analysis through the ANOVA technique.
Using EngineRoom Measure > Measurement System Analysis (MSA) > Gauge R&R
Using EngineRoom There are 3 drop zones attached to the study: Part Number Variable (required): for the variable containing the part numbers. Can be numeric or text. Operator Name Variable (required): for the variable identifying the operator names. Can be numeric or text. Operator Response Variable (required): for the variable containing the measurement data from the study. Must be numeric.
Gauge R&R Example New_VariablegaugeRandR_data.csv New_VariablegaugeRandR_data.csv The data set contains measurement data of 10 samples (parts) taken by each of three appraisers over three trials. A tolerance of +/- 0.6 is associated with the samples. Open the data source to see three column of data: Appraiser (with the names of the three appraisers), Sample (for the part numbers) and Measurement (for the measurement data gathered by the appraisers). Each sample number is repeated three times for each appraiser, representing the three trials.
Gauge R&R Example Click on the data file in the data sources panel and drag Sample onto the Part Number Variable drop zone. Drag Appraiser onto the Operator Name Variable drop zone. Drag Measurement onto the Operator Response Variable drop zone. Now you can enter any of the optional parameters for the study, such as upper or lower specification limits, tolerance or historical standard deviation. Enter the tolerance value of 1.2. Click Continue .
Gauge R&R Output The graphical output contains: Components of Variation bar chart Xbar Chart (you want to see at least 50% of the points falling outside limits on this chart) Range Chart (you want to see points falling within limits on this chart) Data by Parts chart Data by Appraisers chart Parts by Appraisers Interaction Chart
Gauge R&R Output The numeric output contains: The ANOVA Table - Crossed, with Interaction (if the interaction is not significant, a second ANOVA table is displayed without the interaction term where the interaction variance is combined with the repeatability (error) variance. The Gauge R&R table which contains the components of variance output, including %Total and %Study variance. Note: The % Tolerance column is displayed only if you entered at least one specification limit value or a tolerance value in the study setup dialog. Entering an historical standard deviation value in the setup creates an additional column in the Gauge R&R table called % Process.


