GDP Rebasing in Uganda by Samuel Echoku: Insights and Challenges
Estimation and presentation of national accounts data in Uganda, including the rationale for GDP rebasing, data sources, drivers for rebasing, and challenges faced. The presentation outlines key findings, implementation processes, and support from the IMF, highlighting the importance of regular revision of national accounts to reflect changing economic structures.

Download Presentation

Please find below an Image/Link to download the presentation.
The content on the website is provided AS IS for your information and personal use only. It may not be sold, licensed, or shared on other websites without obtaining consent from the author.If you encounter any issues during the download, it is possible that the publisher has removed the file from their server.
You are allowed to download the files provided on this website for personal or commercial use, subject to the condition that they are used lawfully. All files are the property of their respective owners.
The content on the website is provided AS IS for your information and personal use only. It may not be sold, licensed, or shared on other websites without obtaining consent from the author.
E N D
Presentation Transcript
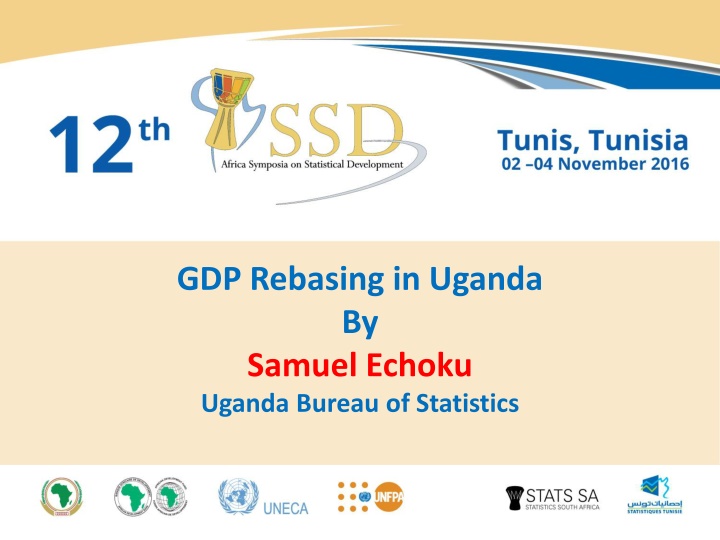
GDP Rebasing in Uganda By Samuel Echoku Uganda Bureau of Statistics
Presentation Outline Background Data Sources Key findings/results Implementation process GDP rebasing IMF support Challenges, opportunities and gap analysis Conclusion 2
Background Estimation and presentation of Uganda national accounts data dates back to 1950. The 1966 base year was used in national accounts compilation up to 1988 ( a period of 22 years) The 1968 SNA was the basis of the 1987, 1991 and lastly 1987/88 GDP rebase. Uganda migrated from 1968 to the 1993 SNA in the 2002 rebase In the 2009/10 GDP rebase the 2008 SNA standard was followed (partially) 3
Background Justification for GDP rebasing: The changing structure of economies, introduction of new standards and methods and the changing production and consumption patterns necessitate a regular revision of the National Accounts Availability of benchmark data to be used in the rebasing Regional requirements - East African Community The revision/rebasing of the National Accounts at intervals not exceeding 5 years international community recommends the
Background The drivers for the rebasing included: Need to adopt new international standards such as the 2008 SNA and the associated classification codes To provide for introduction of new methods In order to adopt new SUT benchmark estimates for the base year To review and revisit the data and methods used to extrapolate the benchmark
Benchmark/GDP rebasing Data Sources The development of the SUT/benchmark estimates was supported by the following data sets: Uganda Census of Agriculture 2008/09, Uganda National Household Survey 2009/10, The National Livestock Census, 2008 Uganda Business Inquiry, 2009/10,
Benchmark/GDP rebasing Data Sources Census of Business Establishments, 2009/10, Non Profit Institutions Survey, 2009/10 The surveys and census data was augmented with secondary data Departments and Agencies (MDA) and, Administrative data such as migration and tax data Trade and Transport Margins (TTM) Study from Ministries,
Key findings/results Milestone 1 of the 2008 SNA achieved 2009/10 GDP was revised to UGX 40.946 trillion shillings from the published 34.908 trillion shillings. A revision upwards of the published 2009/10 GDP by 17.3 percent. FISIM activities/industries that generated it was distributed to the respective
Key findings/results Revisions in Real GDP series 2008/09 2009/10 2010/11 2011/12 2012/13 2013/14 Average GDP at Constant 2009/10 prices (000s) New GDP 38.9 40.9 44.9 Percentage change 5.2 Fiscal Year 46.9 4.4 48.4 3.3 50.6 4.5 9.7 6.0 GDP at Constant 2002 prices (000s) 19.5 20.6 5.9 22.0 6.6 22.8 3.4 24.1 6.0 25.2 4.7 Published GDP Percentage change 5.8
Key Findings/results GDP Structure 2009/10 before & after Rebase (UGX Billion) Economic Sector Published GVA Revised GVA Estimates 8,245 24% 10,732 26% Agriculture 8,675 25% 7,424 18% Industry 46% 49% 15,888 19,861 Services Adjustments GDP 2,100 34,908 6% 2,930 40,947 7%
Key Findings/results Formal -Informal GDP Split by percentage Fiscal Year Formal GDP Sector 2009/10 2010/11 2011/12 2012/13 2013/14 3.5 4.2 13.2 14.9 15.1 34.7 34.8 32.5 51.4 53.8 51.3 Agriculture, forestry and fishing Industry Services Total Formal GDP 3.7 3.6 3.2 14.7 33.3 51.7 14.8 33.4 51.5 Agriculture, forestry and fishing Industry Services Total Informal GDP Total GDP 24.4 22.2 24.5 23.4 23.3 Informal GDP 7.2 17.0 48.6 7.9 16.1 46.2 8.4 15.9 48.7 8.2 16.8 48.3 8.2 17.0 48.5 100.0 100.0 100.0 100.0 100.0
Implementation process Process started with the preparation of an action plan matrix that indicated data availability and activity timeline. The matrix was followed by the profiling of the available data, coding and classifying the data appropriately Adoption of the SNA 2008 standard and associated classifications such as, ISIC Rev 4, CPC 2, COICOP etc. Determination of the SUT structure in terms of activities and products
Implementation process Stage 1 Construction of a benchmark Supply and Use Table (SUT) for 2009/10 Stage 2 Revision and rebasing of the annual estimates Release of the rebased GDP
GDP Rebasing IMF Support The IMF support was mainly: In the 2009/10 SUT compilation exercise and adoption of the new SUT estimates for the base year 2009/10 benchmarks Hands on training in the various processes of SUT compilation and methodology development Reviewing and revising the methods used to extrapolate the benchmark, where necessary completely rebuilding the system that produces the estimates
Challenges, opportunities and gap analysis Challenges: some censuses and surveys were conducted outside the base year necessitating realingnment financial limitations impended the conduct of some surveys and/or censuses, and the engagement of experts were necessary classifications and categorisation of some data sets such as VAT are not in conformity with National Accounts requirements
Challenges, opportunities and gap analysis Challenges: Lack of skilled staff and staff turnover that affects the training and experience gathering required for expertise Poor quality data due short comings in surveys and censuses Data inadequacy due to absence or irregularity of surveys and censuses Poor data quality and/or delays in finalisation and submission of the data
Challenges, opportunities and gap analysis Opportunities: Collaboration with the various Ministries Departments and Agencies could be taken up to improve on the quality and timeliness of external data sources National Accounts staffing levels have now been beefed turnover should be minimized in order to benefit from the additional human resources
Challenges, opportunities and gap analysis Opportunities: Put in place mechanism to start agriculture surveys for food crops, livestock and fishing, and other weak or absent source data The new staff should be encouraged and facilitated to attend and benefit from the various NA training opportunities To reach out for support were necessary
Challenges, opportunities and gap analysis Gap analysis: We failed to access military expenditure data due to confidentiality reasons Limitations in skills required for SUT compilation and GDP rebasing Lack of quality data on agriculture due to absence of surveys and censuses affecting the quality of the estimates for: food crop growing, fishing, livestock rearing and forestry
Conclusion Rebuilding National Statistical Systems is a costly and time consuming exercise that requires external support and political commitment GDP rebasing is a resource intensive and time consuming exercise that requires adequate planning Good data is a prerequisite for the production of quality national accounts and indeed for accurate rebasing. Collaboration with IMF and other partners for TA support has been very fruitful in the development of Uganda s National Accounts and the Statistical System in general