Gender Discrimination in Academic Promotions to Full Professor in Italy
This study explores the gender gap in academic promotions to the rank of full professor in Italian universities between 2013 and 2016. Analyzing various variables such as scientific productivity indicators, age, and position, the research sheds light on the challenges faced by female academics in advancing to senior roles. The findings highlight the trench warfare of gender discrimination prevalent in the promotion process.

Download Presentation

Please find below an Image/Link to download the presentation.
The content on the website is provided AS IS for your information and personal use only. It may not be sold, licensed, or shared on other websites without obtaining consent from the author.If you encounter any issues during the download, it is possible that the publisher has removed the file from their server.
You are allowed to download the files provided on this website for personal or commercial use, subject to the condition that they are used lawfully. All files are the property of their respective owners.
The content on the website is provided AS IS for your information and personal use only. It may not be sold, licensed, or shared on other websites without obtaining consent from the author.
E N D
Presentation Transcript
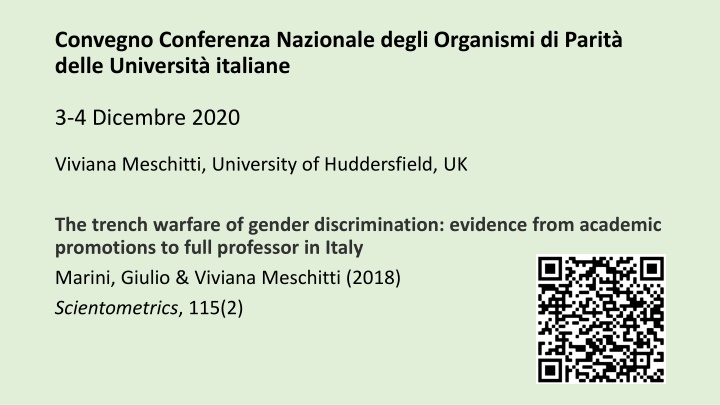
Convegno Conferenza Nazionale degli Organismi di Parit delle Universit italiane 3-4 Dicembre 2020 Viviana Meschitti, University of Huddersfield, UK The trench warfare of gender discrimination: evidence from academic promotions to full professor in Italy Marini, Giulio & Viviana Meschitti (2018) Scientometrics, 115(2)
Gender gap nelle promozioni a professore ordinario, 2013 - 2016 Variabili Promozione a ordinario Genere Indicatori di produttivita scientifica (normalizzati) Eta Posizione (al momento della ASN) Punti organico VQR
ASN Promotions M e M b F b F Disciplinary areas a c a c d d e A1 Mathematics and Informatics 725 309 42.6 261 111 42.5 63 20.4 18 16.2 A2 Physics 1,063 635 59.7 255 154 60.4 68 10.7 11 7.1 A3 Chemistry 430 253 58.8 249 163 65.5 49 19.4 19 11.7 A4 Earth Sciences 327 141 43.1 98 30 30.6 24 17.0 2 6.7 A5 Biology 821 449 54.7 591 270 45.7 72 16.0 33 12.2 A6 Medicine 2,427 1,185 48.8 735 318 43.3 219 18.5 48 15.1 a) Number of ASN applicants Agricultural and Veterinary Sciences A7 513 324 63.2 237 138 58.2 58 17.9 22 15.9 A8 Civil Engineering and Architecture 801 323 40.3 310 116 37.4 75 23.2 22 19.0 b) Number of ASN winners Industrial Engineering and Information Systems Classical Studies, Philology, Arts and Literature A9 1,338 690 51.6 282 138 48.9 153 22.2 27 19.6 c) Percentage of success (b/a [%]) A10 961 484 50.4 1,010 525 52.0 78 16.1 63 12.0 A11 History, Philosophy and Psychology 920 355 38.6 571 261 45.7 66 18.6 48 18.4 d) Number of promoted A12 Law 688 299 43.5 326 165 50.6 86 28.8 39 23.6 A13 Economics and Statistics 911 532 58.4 457 247 54.0 114 21.4 47 19.0 A14 Political and Social Sciences 331 138 41.7 164 73 44.5 36 26.1 16 21.9 e) Percentage of promoted (d/b [%]) Total 12,256 6,117 49.9 5,546 2,709 48.9 1,161 19.0 415 15.3
ASN Promotions M e M b F b F Disciplinary areas a c a c d d e A1 Mathematics and Informatics 725 309 42.6 261 111 42.5 63 20.4 18 16.2 A2 Physics 1,063 635 59.7 255 154 60.4 68 10.7 11 7.1 A3 Chemistry 430 253 58.8 249 163 65.5 49 19.4 19 11.7 A4 Earth Sciences 327 141 43.1 98 30 30.6 24 17.0 2 6.7 A5 Biology 821 449 54.7 591 270 45.7 72 16.0 33 12.2 A6 Medicine 2,427 1,185 48.8 735 318 43.3 219 18.5 48 15.1 a) Number of ASN applicants Agricultural and Veterinary Sciences A7 513 324 63.2 237 138 58.2 58 17.9 22 15.9 A8 Civil Engineering and Architecture 801 323 40.3 310 116 37.4 75 23.2 22 19.0 b) Number of ASN winners Industrial Engineering and Information Systems Classical Studies, Philology, Arts and Literature A9 1,338 690 51.6 282 138 48.9 153 22.2 27 19.6 c) Percentage of success (b/a [%]) A10 961 484 50.4 1,010 525 52.0 78 16.1 63 12.0 A11 History, Philosophy and Psychology 920 355 38.6 571 261 45.7 66 18.6 48 18.4 d) Number of promoted A12 Law 688 299 43.5 326 165 50.6 86 28.8 39 23.6 A13 Economics and Statistics 911 532 58.4 457 247 54.0 114 21.4 47 19.0 A14 Political and Social Sciences 331 138 41.7 164 73 44.5 36 26.1 16 21.9 e) Percentage of promoted (d/b [%]) Total 12,256 6,117 49.9 5,546 2,709 48.9 1,161 19.0 415 15.3
ASN Promotions M e M b F b F Disciplinary areas a c a c d d e A1 Mathematics and Informatics 725 309 42.6 261 111 42.5 63 20.4 18 16.2 A2 Physics 1,063 635 59.7 255 154 60.4 68 10.7 11 7.1 A3 Chemistry 430 253 58.8 249 163 65.5 49 19.4 19 11.7 A4 Earth Sciences 327 141 43.1 98 30 30.6 24 17.0 2 6.7 A5 Biology 821 449 54.7 591 270 45.7 72 16.0 33 12.2 A6 Medicine 2,427 1,185 48.8 735 318 43.3 219 18.5 48 15.1 a) Number of ASN applicants Agricultural and Veterinary Sciences A7 513 324 63.2 237 138 58.2 58 17.9 22 15.9 A8 Civil Engineering and Architecture 801 323 40.3 310 116 37.4 75 23.2 22 19.0 b) Number of ASN winners Industrial Engineering and Information Systems Classical Studies, Philology, Arts and Literature A9 1,338 690 51.6 282 138 48.9 153 22.2 27 19.6 c) Percentage of success (b/a [%]) A10 961 484 50.4 1,010 525 52.0 78 16.1 63 12.0 A11 History, Philosophy and Psychology 920 355 38.6 571 261 45.7 66 18.6 48 18.4 d) Number of promoted A12 Law 688 299 43.5 326 165 50.6 86 28.8 39 23.6 A13 Economics and Statistics 911 532 58.4 457 247 54.0 114 21.4 47 19.0 A14 Political and Social Sciences 331 138 41.7 164 73 44.5 36 26.1 16 21.9 e) Percentage of promoted (d/b [%]) Total 12,256 6,117 49.9 5,546 2,709 48.9 1,161 19.0 415 15.3
ASN Promotions M e M b F b F Disciplinary areas a c a c d d e A1 Mathematics and Informatics 725 309 42.6 261 111 42.5 63 20.4 18 16.2 A2 Physics 1,063 635 59.7 255 154 60.4 68 10.7 11 7.1 A3 Chemistry 430 253 58.8 249 163 65.5 49 19.4 19 11.7 A4 Earth Sciences 327 141 43.1 98 30 30.6 24 17.0 2 6.7 A5 Biology 821 449 54.7 591 270 45.7 72 16.0 33 12.2 A6 Medicine 2,427 1,185 48.8 735 318 43.3 219 18.5 48 15.1 a) Number of ASN applicants Agricultural and Veterinary Sciences A7 513 324 63.2 237 138 58.2 58 17.9 22 15.9 A8 Civil Engineering and Architecture 801 323 40.3 310 116 37.4 75 23.2 22 19.0 b) Number of ASN winners Industrial Engineering and Information Systems Classical Studies, Philology, Arts and Literature A9 1,338 690 51.6 282 138 48.9 153 22.2 27 19.6 c) Percentage of success (b/a [%]) A10 961 484 50.4 1,010 525 52.0 78 16.1 63 12.0 A11 History, Philosophy and Psychology 920 355 38.6 571 261 45.7 66 18.6 48 18.4 d) Number of promoted A12 Law 688 299 43.5 326 165 50.6 86 28.8 39 23.6 A13 Economics and Statistics 911 532 58.4 457 247 54.0 114 21.4 47 19.0 A14 Political and Social Sciences 331 138 41.7 164 73 44.5 36 26.1 16 21.9 e) Percentage of promoted (d/b [%]) Total 12,256 6,117 49.9 5,546 2,709 48.9 1,161 19.0 415 15.3
Risultati La variabile genere e quella che meglio predice la probabilita di essere promosso Due indicatori di produttivita scientifica sono pure rilevanti (numero di articoli / libri e H index / numero di articoli in fascia A) Fra tutti coloro con ASN, gli uomini hanno il 24% di probabilita in piu di ottenere una promozione a professore ordinario (a parita di produttivita scientifica)