Explore gene expression profiles in human osteoarthritis cartilage and an ACLT rat model, revealing upregulated MMP13 and insights into chondrocyte clustering, proteoglycan staining, and disease progression. Additionally, uncover the impact of IL-1 treatment on gene expression and polysome association in rat articular chondrocytes. Validation of results through qPCR and RNA-seq provides a comprehensive view of molecular changes in osteoarthritis and inflammatory responses.
Please find below an Image/Link to download the presentation.
The content on the website is provided AS IS for your information and personal use only. It may not be sold, licensed, or shared on other websites without obtaining consent from the author. If you encounter any issues during the download, it is possible that the publisher has removed the file from their server.
You are allowed to download the files provided on this website for personal or commercial use, subject to the condition that they are used lawfully. All files are the property of their respective owners.
The content on the website is provided AS IS for your information and personal use only. It may not be sold, licensed, or shared on other websites without obtaining consent from the author.
E N D
Presentation Transcript
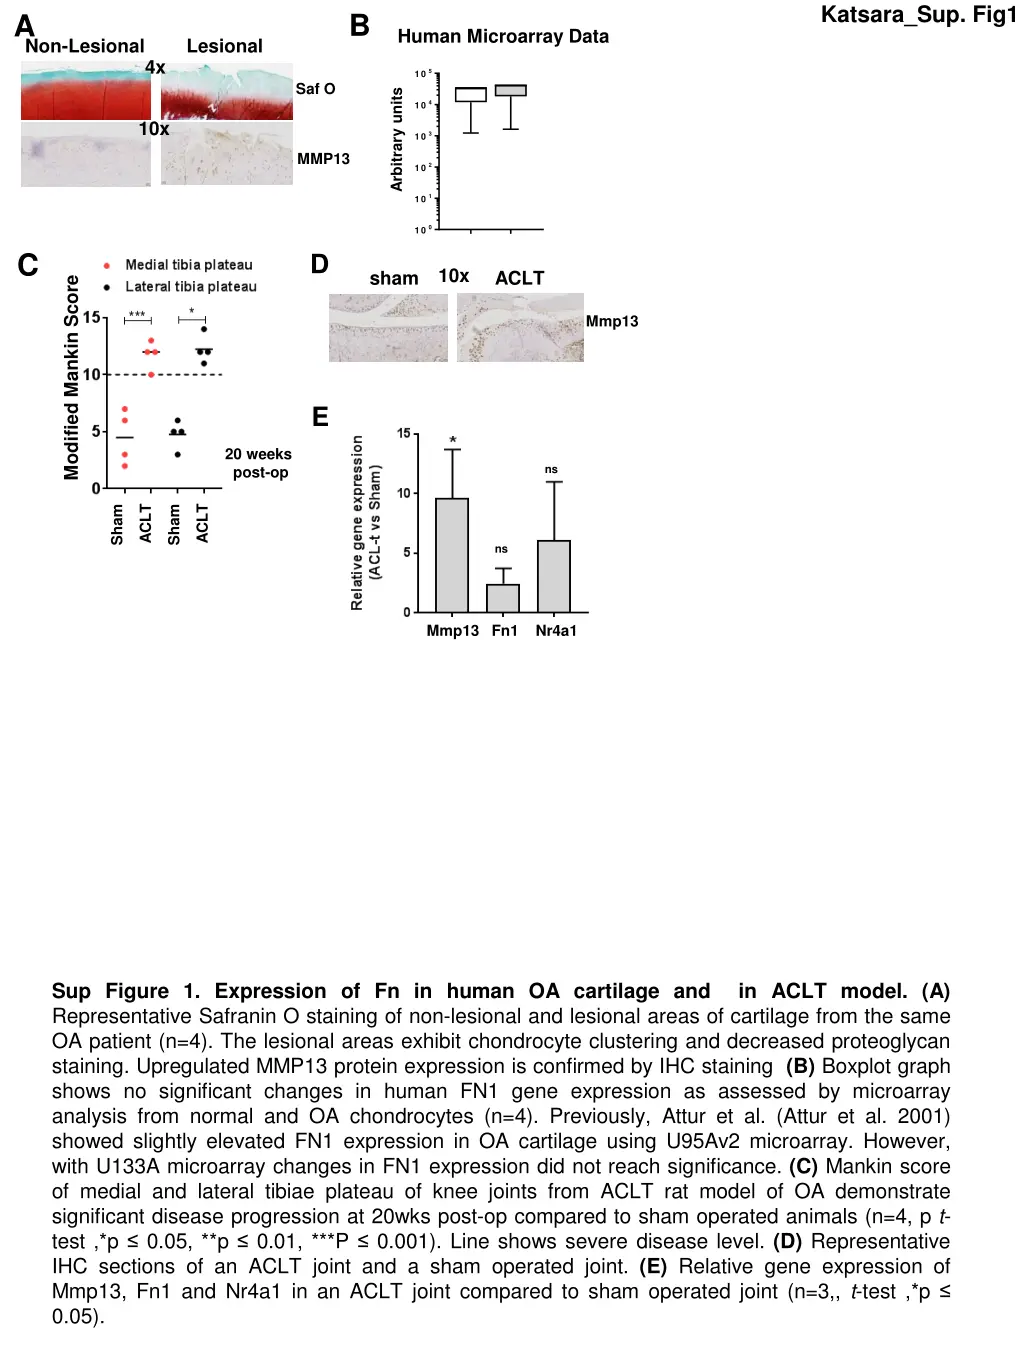
Katsara_Sup. Fig1 B A Human Microarray Data Non-Lesional Lesional 4x 10⁵ R elative gene expression Saf O Arbitrary units 104 10x 103 MMP13 102 101 100 C D 10x sham ACLT O A F N 1 Modified Mankin Score n o rm al F N 1 Mmp13 E 20 weeks post-op ns ACLT ACLT Sham Sham ns Mmp13 Fn1 Nr4a1 Sup Figure 1. Expression of Fn in human OA cartilage and in ACLT model. (A) Representative Safranin O staining of non-lesional and lesional areas of cartilage from the same OA patient (n=4). The lesional areas exhibit chondrocyte clustering and decreased proteoglycan staining. Upregulated MMP13 protein expression is confirmed by IHC staining (B) Boxplot graph shows no significant changes in human FN1 gene expression as assessed by microarray analysis from normal and OA chondrocytes (n=4). Previously, Attur et al. (Attur et al. 2001) showed slightly elevated FN1 expression in OA cartilage using U95Av2 microarray. However, with U133A microarray changes in FN1 expression did not reach significance. (C) Mankin score of medial and lateral tibiae plateau of knee joints from ACLT rat model of OA demonstrate significant disease progression at 20wks post-op compared to sham operated animals (n=4, p t- test ,*p 0.05, **p 0.01, ***P 0.001). Line shows severe disease level. (D) Representative IHC sections of an ACLT joint and a sham operated joint. (E) Relative gene expression of Mmp13, Fn1 and Nr4a1 in an ACLT joint compared to sham operated joint (n=3,, t-test ,*p 0.05).
Katsara_Sup. Fig.2 A +/- IL1 (24h) control O.D. 254nm 15% RNA Isolation, Deep sequencing IL-1 24h Lysis (CHX) 50% polysomes RNA_IL-1b vs RNA_control B C polysome_IL-1b vs polysome_control D Chi3l1 R=0.84 p=3.4e-4 LogFC RNA (IL-1 / control) by RNAseq 20 10 Spp1 Sulf1 Plau1 0 0 10 20 LogFC RNA (IL-1 / control) by qPCR RNA_control vs polysome_control F E R=0.79 p<2.2e-16 10 LogFC polysome (IL- 1 / control) 5 0 -5 LogFC RNA (IL-1 / control) Sup. Figure 2. Steady-state mRNA and polysome-association mRNA profiles of genes expressed in IL-1b treated and untreated rat articular chondrocytes (RAC).(A) Scheme of the polysome profiling. IL-1b treated and untreated RAC were lysed in the presence of cycloheximide (CHX). Extracts were fractionated on a 5 50% linear sucrose gradient, and the absorbance at 254 nm monitored. mRNA isolated from polysome fractions was used for library preparation for HiSeq analysis. (B,D,F) Cluster analysis and smear plots of differentially expressed genes in treated versus untreated samples (B)-polysomes-associated mRNA, (D)-total RNA. (F) Cluster analysis and smear plots of steady-state and polysomes associated mRNA in untreated RAC. Pre-filtering criteria required transcript levels to be altered at least two-fold or 0.5-fold at each time point. Shown is a colored representation of expression data of annotated genes with the rows (genes) and columns in cluster order (from left to right: duplicate samples). The color scale inserted represents fold up- (red) and down- (blue) regulation of genes. Smear plots of Log2FC magnitude vs coverage (2 controls vs 2 treatments (combined from 3 independent experiments); average log expression values (standardized read counts). Differentially translated/expressed transcripts are represented by red dots. A two-sided t-test was performed correcting for multiple testing by controlling for FDR at 1%. (C) Validation of RNA-seq results by qPCR. Correlation plots are indicating the relationship between RNA-seq results (Log fold change Polysome (IL-1 / control); Y-axis) of 11 selected genes and the corresponding data from the qPCR analysis (X-axis) for total RNA. (E) Scatter plot of the fold change in the translatome (Y-axis) vs the transcriptome (X-axis) of IL-1b treated RAC at 24 hours for all identified (11,039) genes.
Katsara_Sup. Fig3 A B C Plau sham ACLT Non-Lesional Lesional 63x Plau (sup) 63x NR4A1 BF actin IL-1 - + DAPI DAPI F n 1 5 RNA(HiSeq) Polysomes(HiSeq) RNA(qPCR) Polysomes(qPCR) R elative gene expression R N A S eq Mmp13 * MMP13 to untreated control p ol S eq 4 R N A P C R 3 p o l P C R 2 Nr4a1 DAPI D 1 Human Microarray Data 0 fn fn fn fn 1 E 105 105 105 ns ** ** R elative gen e expression R elative gen e expression ** R elative gene expression norm al norm al norm al Relative gene expression OA *** Arbitrary units lesion vs non-lesion OA OA *** *** 104 104 104 103 103 103 102 O A A sp n 102 n o rm al A sp n O A S u lf O A S T A T 1 O A A sp n n o rm al S u lf1 O A N R 4A n o rm al S T A T 1 O A S u lf n o rm al N R 4A n o rm al S u lf1 SULF1 NR4A1 FN1 102 O A A sp n n o rm al A sp n n o rm al A sp n 300 O A S u lf Relative gene expression O A S T A T 1 O A S T A T 1 n o rm al S u lf1 O A N R 4A n o rm al S T A T 1 O A N R 4A n o rm al S T A T 1 3 n o rm al N R 4A n o rm al N R 4A F ns 24hrs IL-1 4 400 * to untreated control ns 2 200 1 100 0 0 Nr4a1 Fn1 MMP13 Sup Figure3. Validation of RNAseq data. (A) Bars show levels of Aspn and Plau expression as a FC(IL-1 treated vs. untreated RAC). (n=3, t-test, **p 0.01). WB analyses of IL-1 -treated RAC confirm increased expression of Plau; ( -actin is used as a loading control, loading 40 g of total protein, or 1/20 of a collected supernatant normalized to total protein) (B,C) Representative immunofluorescence staining of Mmp13 and Nr4a1 in (C) ACLT and sham-operated joints and in (D) human lesional and non-lesional areas. (D) Boxplot graph shows human microarray data from normal and OA chondrocytes with significantly increased expression of SULF1 in OA samples, but no significant changes in NR4A1 expression compared to normal cells. The box signifies the 5-95 percentiles, and the median is represented by a black line within the box. (n=5; t-test,*p 0.05, **p 0.01, ***p 0.001). (F) Graph shows relative levels of gene expression, analyzed by qPCR, for FN1 as a fold change (lesion versus non-lesion; n=5,unpaired t-test).(G) Graphs show levels of gene expression, analyzed by qPCR, for MMP13, NR4A1 and FN1 as a fold change (treated vs untreated). Articular human chondrocytes were isolated from non-lesional areas (n=7,unpaired t-test,*p 0.05).
Katsara_Sup. Fig4 sulf1 expression (treated vs untreated) A m m p 13 N r4a1 Mmp13 Fn1 Sulf1 Nr4a1 15 1000 A A + 5 Fold difference in gene A A + A A + vector+ A A + vector+ 4 10 100 3 2 5 10 1 0 0 1 A A + A A + A A + A A + vecto r+ vecto r+ A A + A A + vecto r+ vecto r+ vecto r+ vecto r+ total RNA polysome RNA B 4E-BP1(AA) Control 24h IL-1 24h IL-1b Sulf1 (red) Fn1 (red) Nr4a1 (red) DAPI-blue Sup.Fig.4 Expression of 4E-BP dominant negative mutant lessens effect of IL-1 on the expression of translationally controlled targets. (A) Fold change in mRNA expression from total, and polysomes-bound mRNA was analyzed by qPCR in treated for 24hrs with IL1 and untreated cells transfected with the mutant or vector for 48hrs (n=3; data are represented as means s.e.m. treated vs. untreated; student s t-test). (B) Immunofluorescent analysis of RAC transfected with the mutant 4E-BP(AA) or a vector shows effect of 4E-BP1(AA) on Fn1, Sulf1 and Nr4a1 expression in IL-1 stimulated cells. DAPI and red images are merged.
Katsara_Sup. Fig5 Mmp3 Fn1 Col2a1 Acan ns ** ns Fold difference in gene 2.0 2.0 2.0 ** 250 * ** ns ns 1.5 1.5 200 1.5 expression 150 1.0 1.0 1.0 ns 100 0.5 0.5 0.5 *** 50 **** ns 0.0 0.0 0.0 0 DMSO DIM Acan/DMSO DMSO DIM MMP3/DMSO Acan/DIM Col2A1/DMSO Col2A1/DIM DMSO DIM DMSO DIM Fn1/DMSO MMP3/DIM Fn1/DIM Sup.Fig.5 Fold change in mRNA expression for indicated genes was analyzed by qPCR in treated for 24hrs with IL1b and untreated cells pre-treated with DMSO or DIM (n=4; data are represented as means sd; significance is estimated for each condition individually as compared to untreated cells (indicated above each bar; unpaired t-test); significance between different conditions is indicated above the brackets (two tailed paired t-test; *p 0.05, **p 0.01).
Katsara_Sup. Fig6 B C A 4E1Rcat Cnt Rap - + - + - + Treatment Scheme 24h r IL 1b (10n g /m l) IL-1 30min 4E1RCat (10 mg/kg) p-AKT (S473) 10 ACLT % G FP positive cells 8 AKT 6 Day 0 8wks 12wks untreated cnt p-Erk1/2 (T202/Y204) 4 ACLT (10x) 2 Vehicle 4E1RCat Erk1/2 0 cn t+ D u al+ p-p70S6K (T421,S424) D p70S6K DMSO DMSO 4E1RCat 4E-BP1(S65) Mmp13 4E-BP1 Sulf1 Nr4a Fn1 sham ACLT ACLT Sup. Fig. 6. (A). WB analyses of IL-1 -treated and untreated RAC cells which were either pre- incubated with DMSO, or Rapamycin, or 4E1RCat ( -actin is used as a loading control, 20 g of total protein was loaded. Importantly, pre-treatment with the inhibitor did not affect IL-1 induced activation of AKT and MAPK and did not induce apoptosis (6B). (B) TUNEL assay for apoptosis detection. Not significance changes were detected between vehicle and 4E1RCat treated RAC cells. Importantly, pre-treatment with the inhibitor did not affect IL-1 induced activation of AKT and MAPK and did not induce apoptosis.(C) Treatment Scheme. At 8 weeks post-op animals randomly received vehicle or 4E1RCat once weekly for 4 weeks. Animals were sacrificed at the end of week 12 post-op and joints were analyzed by a modified mankin score using Toluidine Blue staining. (D) Representative IHC stained sections (20X) show increased expression of Mmp13 and of the newly identified targets: Sulf1, Nr4a, and Fn1 in ACLT vehicle treated joints compared to 4E1RCat treated joints. All sections were counterstained with hematoxylin and eosin (H&E).