Genetic and Phenotypic Analysis of Fruit and Seed Traits
Explore the frequency distribution of family means for various traits in the 2016-2017 experiments, correlation matrix between traits, collinearity analysis, QTL detection across chromosomes, and QTL locations for fruit-related traits. View the global analysis and insights on brix content, seed dimensions, fruit characteristics, and more.

Download Presentation

Please find below an Image/Link to download the presentation.
The content on the website is provided AS IS for your information and personal use only. It may not be sold, licensed, or shared on other websites without obtaining consent from the author. If you encounter any issues during the download, it is possible that the publisher has removed the file from their server.
You are allowed to download the files provided on this website for personal or commercial use, subject to the condition that they are used lawfully. All files are the property of their respective owners.
The content on the website is provided AS IS for your information and personal use only. It may not be sold, licensed, or shared on other websites without obtaining consent from the author.
E N D
Presentation Transcript
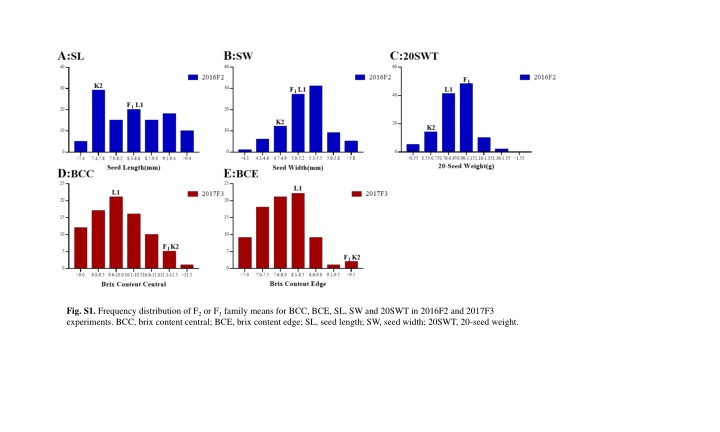
Fig. S1. Frequency distribution of F2or F3family means for BCC, BCE, SL, SW and 20SWT in 2016F2 and 2017F3 experiments. BCC, brix content central; BCE, brix content edge; SL, seed length; SW, seed width; 20SWT, 20-seed weight.
Fig. S2. Correlation matrix between the measured traits. The scale represent the values of Pearson s correlation coefficient between the traits using the mean value across the blocks for each variable. FW, fruit weight; FFC, fruit flesh color; RC, rind color; RSP, rind stripe pattern; BCC, brix content central; BCE, brix content edge; SL, seed length; SW, seed width; 20SWT, 20-seed weight; FD, fruit diameter; FL, fruit length; FSI, fruit shape index.
C D A B E F G H J K I Fig S3. Collinearity analysis between the physical map and the genetic map. For each chromosome, the left panel indicates alignment of markers on the genetic map against the pseudo-chromosome, and the right panel shows plotting of genetic distances against physical distances. The X axis is the marker position on the physical map, and the Y axis is the marker position on the genetic maps. The numbers in the figure represent the Spearman rank correlation coefficients between the marker order of the genetic maps and the physical map. A-K: chromosome1-chromosome 11
Fig. S4. A global view of all QTL detected across the eleven chromosomes is provided. The X axis represents linkage map of 11 chromosomes, and Y axis is LOD score. FW, fruit weight; FFC, fruit flesh color; RC, rind color; RSP, rind stripe pattern; BCC, brix content central; BCE, brix content edge; SL, seed length; SW, seed width; 20SWT, 20-seed weight; FD, fruit diameter; FL, fruit length; FSI, fruit shape index.
A:RC B:RSP C:FFC D:FD E:FL F:FSI G:FW Fig. S5. Global view of QTL locations for different fruit-related traits detected in both 2016F2 and 2017F3 experiments. For each trait, the X axis represents linkage map of 11 chromosomes, and Y axis is LOD scores. (A) RC; (B) RSP; (C) FFC; (D) FD; (E) FL; (F) FSI; (G) FW. FW, fruit weight; FFC, fruit flesh color; RC, rind color; RSP, rind stripe pattern; FD, fruit diameter; FL, fruit length; FSI, fruit shape index.
A B D C E Fig. S6. Global view of QTL locations for different fruit and seed traits detected from single environment. For each trait, the X axis represents linkage map of 11 chromosomes, and Y axis is LOD scores. (A) BCC; (B) BCE; (C) SL; (D) SW; (E) 20SWT. BCC, brix content central; BCE, brix content edge; SL, seed length; SW, seed width; 20SWT, 20-seed weight;


