Geographic Information Systems Introduction
This introduction covers the fundamental principles of Geographic Information Systems (GIS), its applications in various professions, challenges in dealing with spatio-temporal data, and the capabilities of GIS systems. It also explores specific examples like El Niño and La Niña patterns and the process of data capture for GIS through the collection of sea surface temperature and wind speed measurements using buoys.
Uploaded on | 0 Views
Download Presentation

Please find below an Image/Link to download the presentation.
The content on the website is provided AS IS for your information and personal use only. It may not be sold, licensed, or shared on other websites without obtaining consent from the author. If you encounter any issues during the download, it is possible that the publisher has removed the file from their server.
You are allowed to download the files provided on this website for personal or commercial use, subject to the condition that they are used lawfully. All files are the property of their respective owners.
The content on the website is provided AS IS for your information and personal use only. It may not be sold, licensed, or shared on other websites without obtaining consent from the author.
E N D
Presentation Transcript
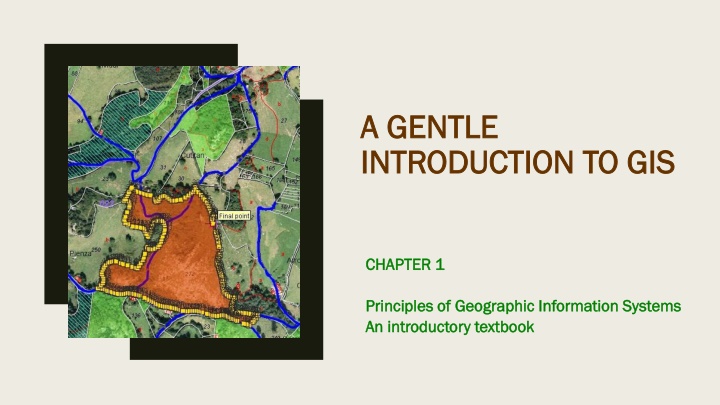
A GENTLE A GENTLE INTRODUCTION TO GIS INTRODUCTION TO GIS CHAPTER 1 CHAPTER 1 Principles of Geographic Information Systems Principles of Geographic Information Systems An introductory textbook An introductory textbook
Nature of GIS GIS Geographic Information System Tool for working with geographic information Applications:- used by urban planner, biologist, natural hazard analyst, geological engineer, mining engineer, geoinformatics engineer, forest manager etc Professionals work with positional data(relative to earth s surface) spatial data (where things are) Challenge in GIS spatio-temporal problem The object of study has different characteristics for different locations (spatial/geographic dimension) and these characteristics change over time (temporal dimension) Sudha Bhagavatheeswaran, Department of Information Technology, SIES College of Arts, Science & Commerce (Autonomous)
El Nino little boy is an aberrant pattern in weather and sea water temperature(every 4-9 years) in Pacific Ocean along equator. Makes weather hotter, has impact on global weather systems, comes around Christmas La Nina little girl pattern of colder temperature that occurs less frequently. Figure marked 1 & 2 El Nino that occurred in the year 1997 Figure marked 3 & 4 La Nina that occurred in the year 1998 SST Sea Surface Temperature (oC) & WS Average wind speed (m/s) Example 1997 1997 1998 1998 3 3 1 1 4 4 2 2
Defining GIS Computer based system Produces four sets of capabilities to handle georeferenced data:- Data Capture and preparation Data management; storage and maintenance Data manipulation and analysis Data presentation GISystems, GIScience, GIS Applications Sudha Bhagavatheeswaran, Department of Information Technology, SIES College of Arts, Science & Commerce (Autonomous)
Data Capture Collection of Sea Surface Temperature and wind speed measurements. This is achieved by placing buoys with measuring equipments at various places in the ocean. ( buoy - an anchored float serving as a navigation mark) 70 buoys. A buoy measures:- i) wind speed & direction ii) air temperature & humidity iii) sea water temperature at surface and depth upto 500 m. Sudha Bhagavatheeswaran, Department of Information Technology, SIES College of Arts, Science & Commerce (Autonomous)
Data Management 01 02 03 Storage and maintenance of data transmitted by the buoys via satellites Transfer data in digital form to begin analysis Decision on how best to present data (in terms of spatial properties and various attributes) Sudha Bhagavatheeswaran, Department of Information Technology, SIES College of Arts, Science & Commerce (Autonomous)
Data Manipulation and Analysis For each buoy, average SST for each month calculated using daily SST measurements. For each buoy, monthly average SST was taken with geographic location to obtain georeferenced list of averages. From this georeferenced list, through a method of spatial interpolation, the estimated SST of other positions were computed. (Table below) GIS function: deriving an estimate GIS function: deriving an estimate value for a property for some location value for a property for some location where we have not measured where we have not measured Previous to the above steps, we obtained data about average SST for December for a series of years. This is spatially interpolated to obtain a normal situation for December data set. Georeferenced: associated with some Georeferenced: associated with some position on Earth s surface by using position on Earth s surface by using spatial reference system (latitude spatial reference system (latitude longitude co longitude co- -ordinate system) ordinate system) A statistical method of deriving a A statistical method of deriving a simple function from the given simple function from the given discrete data set such that the discrete data set such that the function passes through the provided function passes through the provided data points is called interpolation. data points is called interpolation. Sudha Bhagavatheeswaran, Department of Information Technology, SIES College of Arts, Science & Commerce (Autonomous)
Data Presentation Message:- What message to portray? to explain what is el nino and la nina events. Audience:- Who is the audience? students, people in general, analysts Medium What form to present it? paper, book formats, size Rules of aesthetics How will it look? north up, clear georeferencing, use of symbols etc. Techniques color scheme, isolines etc. Sudha Bhagavatheeswaran, Department of Information Technology, SIES College of Arts, Science & Commerce (Autonomous)
Spatial Data and Geoinformation Data Spatial Data Data with positional values Geospatial data - Spatial data that is georeferenced. Spatial data synonymn - Georeferenced data Geoinformation information resulting from interpretation of spatial data Components of spatial data Positional accuracy(horizontal and vertical) Temporal accuracy(data up to date) Attribute accuracy(labelling of features) Lineage(history of data including sources) Completeness(data set represents all related features of reality) Logical consistency(data is logically structured) Sudha Bhagavatheeswaran, Department of Information Technology, SIES College of Arts, Science & Commerce (Autonomous)
Modelling Representation of a part of the world. Make decisions effectively, predict Helps us answer what-if questions Change/alter parameters of the model to investigate the changes. Real world model - representation of a number of phenomena that we can observe in reality, to enable some type of study, administration, computation or simulation. Maps paper model Databases digital model Both are static models Process models are dynamic (emphasise changes) Sudha Bhagavatheeswaran, Department of Information Technology, SIES College of Arts, Science & Commerce (Autonomous)
Maps Best known conventional model Is a graphical representation at certain level of detail determined by scale Disadvantage:- restricted to 2D static representation and display in a fixed scale. Map scale determines the spatial resolution of graphic feature representation. Smaller the scale, less detail a map can show. Selection of a proper scale is important. Have physical boundaries and is the data source for other applications. Cartography Art and Science of map making, interpreter that translates real world phenomena into correct clear understandable representations for our use. Digital Cartography with the advent of computers. Sudha Bhagavatheeswaran, Department of Information Technology, SIES College of Arts, Science & Commerce (Autonomous)
Repository for storing large amounts of data. Databases Concurrent use, data integrity rules on stored data Number of techniques to store data(storage optimization) Easy to use DML query facility Each query executed in the most efficient way query optimization Spatial databases to store spatial data Representation in a spatial database may have a point, line, area or image characteristics. Sudha Bhagavatheeswaran, Department of Information Technology, SIES College of Arts, Science & Commerce (Autonomous)


