Ghana Producer Price Index & Inflation January 2023 Highlights
In this release, the Ghana Producer Price Index (PPI) and Producer Inflation for January 2023 are detailed. The PPI measures the average change over time in selling prices received by domestic producers. The inflation rate at factory gate prices for goods and services was 52.1% year-on-year in January 2023. Monthly changes and key insights are provided for a comprehensive understanding of the economic landscape.

Download Presentation

Please find below an Image/Link to download the presentation.
The content on the website is provided AS IS for your information and personal use only. It may not be sold, licensed, or shared on other websites without obtaining consent from the author.If you encounter any issues during the download, it is possible that the publisher has removed the file from their server.
You are allowed to download the files provided on this website for personal or commercial use, subject to the condition that they are used lawfully. All files are the property of their respective owners.
The content on the website is provided AS IS for your information and personal use only. It may not be sold, licensed, or shared on other websites without obtaining consent from the author.
E N D
Presentation Transcript
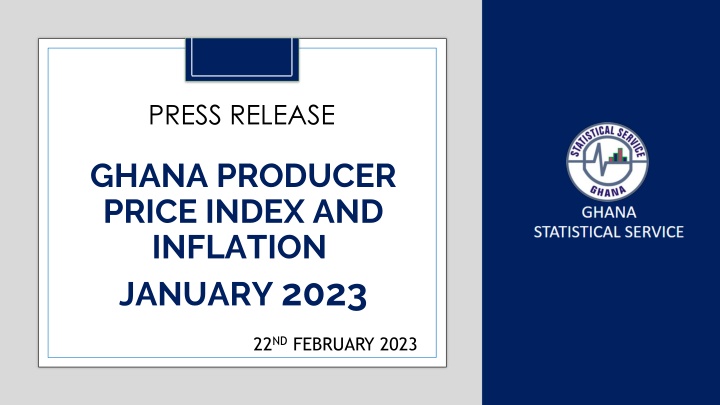
PRESS RELEASE GHANA PRODUCER PRICE INDEX AND INFLATION JANUARY 2023 22ND FEBRUARY 2023
In this release, we present: Definition and Measurement of the Producer Price Index (PPI) Producer Price Index and Producer Inflation for January 2023 Disaggregation of the 2023 Producer Inflation Highlights of January 2023 Producer Inflation 2 22/02/2023
Definition and Measurement of PPI and Inflation (1/2) The Producer Price Index (PPI) measures the average change over time in the selling prices of goods and services as received by domestic producers. Price collected for the computation of PPI are known as factory gate prices, which are the prices firms assign to their products. These prices exclude sales and excise taxes, government subsidies other costs incurred by other intermediaries and consumers The rate of Producer Inflation is the relative change in PPI between periods 3 22/02/2023
Definition and Measurement of PPI and Inflation (2/2) PPI computation is based on a fixed basket of products. Firms are the primary source of data Firms are selected based on the Integrated Business Establishment Survey Variables for the computation of PPI are weights, prices, quantities and products. Two reference periods for the computation of PPI are the weight reference (industry and product shares) and the index reference for price comparison. The computation is done from a dual time perspective, monthly and annually 4 22/02/2023
Reference Periods - PPI and Inflation Weight Reference-2019 Weight reference at the industry level is based on 2019 Gross Value Output (GVO) Selection of firms is based on the Integrated Business Establishment Survey (II) Index Reference (Price Comparison) March 2020 to February 2021 =100 5 22/02/2023
PPI Weights 6 22/02/2023
Producer Price Index and Producer Inflation for January 2023 Year-on-year inflation rate at factory gate prices for all goods and serviceswas 52.1 % in January 2023. Month PPI Inflation (03/2020-02/2021 =100) Monthly Yearly 117.0 - - Dec. 2021 178.3 -13.3 52.2 Dec. 2022 The monthly change rate was 0.9%. p179.6 p0.9 p52.1 Jan. 2023 p = provisional 7 22/02/2023
Disaggregation of the 2023 Producer Inflation by Sectors Dec.-22 Jan.-23 70.0 65.7 58.6 60.0 50.0 40.0 Percent 30.0 22.1 20.4 20.0 10.5 9.5 10.0 0.0 Industry Construction Service 8 22/02/2023
Disaggregation of the 2023 Producer Inflation by Sub-Sectors Yearly Monthly Mining 2.2 68.2 Mining Transportaton and storage 0.1 62.6 Transportaton and storage -0.2 Manufacturing 53.3 Manufacturing Overall 0.9 52.1 Overall Accommodation and food service activities Accommodation and 1.1 40.1 -0.3 Electricity and gas 29.9 Electricity and gas Construction 4.3 20.4 Construction Water supply; sewerage, waste management Water supply; sewerage, 2.6 26.0 -1.1 Information and 1.2 Information and communication 22/02/2023 9
Change in Sub-Sector Producer Inflation Dec. Vs. Jan. 2023 Dec-2022 Jan-2023 80.0 73.4 68.2 70.0 64.3 63.6 62.6 60.0 53.3 50.0 Percent 40.1 40.0 34.7 30.4 29.9 30.0 26.0 24.1 22.1 20.4 20.0 10.0 2.3 1.2 - Mining and quarrying Manufacturing Electricity and gas Water supply, sewerage, waste management Construction Transportation and storage Accommodation and food service activities Information and communication 10 22/02/2023
Manufacturing Sub-Sector Dec-2022 Jan-2023 Manufacture of coke and refined petroleum products 174.4 166.8 Manufacture of pharmaceuticals and botanical products 112.5 123.7 Manufacture of basic metals 66.0 68.2 Manufacture of food products 83.4 67.0 Manufacture of computer, electronic and optical products 81.6 61.6 Manufacture of wood and of products of wood and cork 61.1 61.8 Manufacture of rubber and plastics products 43.8 60.0 56.6 Manufacture of furniture 56.3 Manufacture of other non-metallic mineral products 36.8 46.0 Printing and reproduction of recorded media 48.2 44.6 Manufacture of chemicals and chemical products 38.2 38.4 11 22/02/2023
Mining and Quarrying Sub-sector Dec-2022 Jan-2023 90.0 85.2 83.6 82.9 80.0 71.8 68.3 67.1 70.0 64.3 59.6 60.0 Percent 50.0 44.9 40.0 26.2 30.0 20.0 10.0 - Mining support service activities Mining of metal ores Other mining and quarrying Extraction of Crude and natural gas Mining less crude oil 12 22/02/2023
Construction Sub-Sector Dec-2022 Jan-2023 90.0 78.0 80.0 70.0 60.0 50.0 45.9 Percent 40.0 30.0 20.0 11.4 10.0 5.5 4.9 4.4 0.0 Construciton of buildings Civil engineering Speicalized construction activities 22/02/2023 13
Services Sub-sector Dec-22 Jan-23 108.9 Air transport Warehousing and support activities for transportation 62.1 62.7 73.5 73.5 Information service activities 60.8 79.7 Land transportation and transport via pipelines 61.0 61.0 Water transportation 56.8 33.6 Accommodation 46.6 44.5 Food and beverage service activities Motion picture, video and television production, sound recording and music publishing 45.7 45.6 15.6 16.4 Publishing activities 51.4 44.8 Postal and courier activities -5.6 1.9 Programming and broadcasting activities Computer programming, consultancy and related activities 6.3 5.9 0.0 0.0 Telecommmunications 22/02/2023 14
Highlights (1/3) The new PPI is referenced March 2020 February 2021 Weight reference is 2019 22/02/2023 15
Highlights (2/3) 53.3 % 68.2 % Mining and quarrying Manufacturing 26.0% 65.7 % Industry Water supply, sewerage and waste management 29.9% Electricity and gas 52.1 % January 2023 yearly change in Producer Price Inflation 52.2 % December 2022 yearly change in Producer Price Inflation 62.6 % Transport and storage 9.5 % Service 20.4 % Constructio ns 40.1 % Accomodati on and food 1.2 % Information and communicatio n 22/02/2023 16
Highlights (2/3) -0.2% 2.2 % Manufacturing Mining and quarrying 2.6 % 1.1 % Industry Water supply, sewerage and waste management -0.3% Electricity and gas 0.9 % December 2022 monthly change in Producer Price Inflation -13.3 % December 2022 monthly change in Producer Price Inflation 0.1 % Transport and storage -0.8% Service 4.3 % Constructio ns 1.1 % -1.1 % Information and communicatio n Accomodati on and food 22/02/2023 17
Thank You For enquiries, please contact Mr. Anthony Krakah Head, Industrial Statistics, Ghana Statistical Service Email: anthony.krakah@statsghana.gov.gh


")
")


")
")
")