GIS Data Formats and Concepts
Explore the world of Geographic Information Systems (GIS) through an in-depth look at various data formats and concepts, including shapefiles, geometry features, and map projections. Discover why GIS is essential for effective communication, model improvement, and data integration. Learn about the significance of ESRI ArcGIS and its relationship to QGIS, an open-source alternative. Dive into different types of GIS data such as points, lines, polygons, and raster images. Join us on a journey to grasp the fundamentals of GIS technology and its practical applications.

Download Presentation

Please find below an Image/Link to download the presentation.
The content on the website is provided AS IS for your information and personal use only. It may not be sold, licensed, or shared on other websites without obtaining consent from the author. If you encounter any issues during the download, it is possible that the publisher has removed the file from their server.
You are allowed to download the files provided on this website for personal or commercial use, subject to the condition that they are used lawfully. All files are the property of their respective owners.
The content on the website is provided AS IS for your information and personal use only. It may not be sold, licensed, or shared on other websites without obtaining consent from the author.
E N D
Presentation Transcript
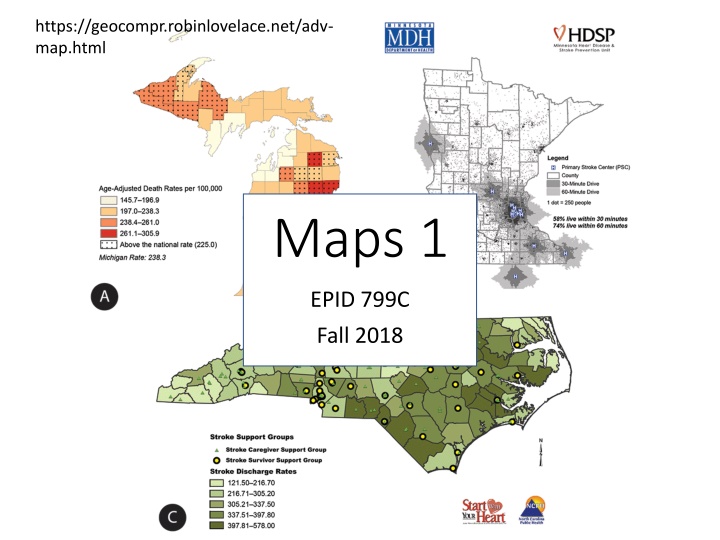
https://geocompr.robinlovelace.net/adv- map.html Maps 1 EPID 799C Fall 2018
To follow along Load objects from today s rdata file (may need to install some packages!) Download and install QGIS
Today Wednesday Basic map concepts Starter spatial analysis Basic spatial code Example map projects
Why make maps (use GIS)? Easy communication. Improve models. Link data.
ESRI (ArcGIS) = The SAS of GIS We won t use ArcGIS, but it is important to understand because: The most common GIS data format (shapefile) has been inherited from ArcGIS. QGIS (which we will use) is an open-source equivalent to ArcGIS. Due to marketing, investment, certification, etc. you will see a lot of work done in ArcGIS. The file format is a nice introduction to spatial data.
Shapefiles 90s relic Most common GIS data format Information stored across many files: .shp geometry feature information (i.e. counties) .shx index of features .dbf attributes of each geometry (i.e. population) .prj projection information .shp.xml metadata (documentation) Imagine if Word documents were split into 5 files
Geometry Features (.shp) Actually just a list of coordinate sets Software connects each set into a polygon (1,3) X 0 0 1 2 Y 0 2 3 2 (0,2) (2,2) (0,0)
Geometry projection (.prj) The earth isn't flat, but maps are! How do the coordinates stretch to the earth? TWO Basic Types: Geographic ( GPS ) Latitude/longitude Pseudo-spherical Projected ( Survey ) Feet/meters Rectangular
Geometry attributes (.dbf) Just a regular dataset Each row is a polygon in dataset ID Area Toxins Cases 0 1 2 3 12 99 120 54 1000 0 200 50 10 1 5 2
ESRI/ArcGIS Junk (don't delete!) Shapefile index (.shx) Helps ArcGIS do queries faster Metadata (.shp.xml) Data source, notes, etc. Other (also in .shp) Presence of holes in features Bounding box (maximum map extent) Shape type (point, line, polygon)
Using QGIS Point-and-click; nice for making maps (start in R)
Lets take a quick look! Open QGIS and a new project 1. Drag the county shapefile from the map pack in 2. That s it! 3.
The sp package in R Packs GIS data into an addressable object (with @) SpatialPointsDataFrame @ @ @ proj4string polygons data bbox $ $ plotOrder var2 var1 You can also use [ ] notation to subset
Working with spatial data With rgeos and rgdal installed, common data commands will be intuitively translated! plot(myshape) myshape$var1 myshape[1:2,] myshape[myshape$var1==FALSE,] Sp objects work like any other object: mile3 <- gbuffer(myshape,3*5280) cents <- gcentroid(myshape)
Note: There s a new structure in town! Simple features (sf) spec just a dataframe! The spatial information is stored as another variable Not quite as efficient in some ways, but easier to work with. Can use overload dplyr functions like spatial-aware left_join() and group_by(). We ll transition to this today. Suggest doing as much spatial work with sf objects as you can.


?")
")
")
")
")
 = The SAS of GIS")

")
")
")
")


![❤Book⚡[PDF]✔ Star Maps: History, Artistry, and Cartography (Springer Praxis Book](/thumb/21625/book-pdf-star-maps-history-artistry-and-cartography-springer-praxis-book.jpg)