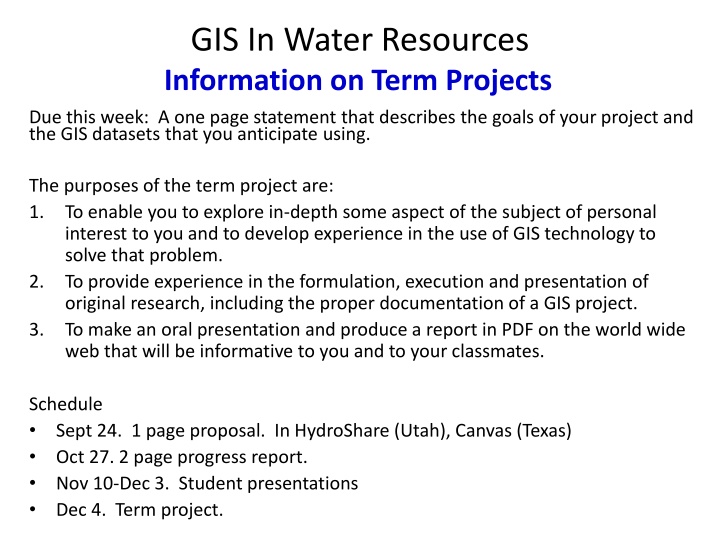
GIS In Water Resources
This term project focuses on utilizing GIS technology to address water resource management issues. Participants are tasked with exploring a personal aspect of the subject, conducting original research, and presenting findings. Scheduled milestones include proposal submission, progress reporting, student presentations, and final report delivery. Emphasis is on problem-solving using GIS datasets and technology, culminating in an oral presentation and web-based report. Relevant topics include Utah State Plane System, slope calculations, topographic analysis, and ArcGIS tools for slope and aspect determination.

Download Presentation

Please find below an Image/Link to download the presentation.
The content on the website is provided AS IS for your information and personal use only. It may not be sold, licensed, or shared on other websites without obtaining consent from the author.If you encounter any issues during the download, it is possible that the publisher has removed the file from their server.
You are allowed to download the files provided on this website for personal or commercial use, subject to the condition that they are used lawfully. All files are the property of their respective owners.
The content on the website is provided AS IS for your information and personal use only. It may not be sold, licensed, or shared on other websites without obtaining consent from the author.
E N D
Presentation Transcript
GIS In Water Resources Information on Term Projects Due this week: A one page statement that describes the goals of your project and the GIS datasets that you anticipate using. The purposes of the term project are: 1. To enable you to explore in-depth some aspect of the subject of personal interest to you and to develop experience in the use of GIS technology to solve that problem. 2. To provide experience in the formulation, execution and presentation of original research, including the proper documentation of a GIS project. 3. To make an oral presentation and produce a report in PDF on the world wide web that will be informative to you and to your classmates. Schedule Sept 24. 1 page proposal. In HydroShare (Utah), Canvas (Texas) Oct 27. 2 page progress report. Nov 10-Dec 3. Student presentations Dec 4. Term project.
Today Homework assigned due Sept 29 (1 week) Exercise assigned Due Oct 1 (9 days) Homework 1 guidance (Utah State Plane System Spatial Reference) Complete presentation on slope Work high points of Exercise 3
Utah State Plane System (North) Central Meridian Std Parallel 2 Origin ?0,?0 = 40.33 N, 111.5 W ?0,?0 = 500000,1000000 Std Parallel 1 Latitude of Origin
Utah State Plane System (North) Central Meridian -111.5 ?0,?0 = 41.754, 111.846 ? ? = 41.754 40.333 180 6371 ? = 158.008 ?? Latitude of Origin 40.333 ? ? = 111.846 ( 111.5) 180 ? 6371 cos 41.754 = 28.702 ?? Projected coordinates (approx.) Origin ?,? = (500000 28702, 1000000 + 158008) = 471298,1158008 ?????? ?0,?0 = 40.33 N, 111.5 W ?0,?0 = 500000,1000000
Topographic Slope Defined or represented by one of the following Surface derivative z (dz/dx, dz/dy) Vector with x and y components (Sx, Sy) Vector with magnitude (slope) and direction (aspect) (S, ) See http://www.neng.usu.edu/cee/faculty/dtarb/giswr/2015/Slope.pdf
Slope and Aspect ? ? ? = aspect clockwise from North ? ? ?
ArcGIS Slope tool y a b c +? ? 2 2 ? ? 2 +? ? 2 2 ? ? 2 d e f + 2 g h i x dz dx= a + 2d + g c + 2f + i 8 ? ? 2 Similarly ? ? 2 dz dy= g + 2h + i a + 2b + c 8 ? ? 2 c b f Slope magnitude = a e i 2 2 d h ?? ?? ?? ?? + g 2 x y
ArcGIS Aspect the steepest downslope direction dz dz / dx x ? = = atan atan dy dz / dy y dz ? = dx ? Use atan2 to resolve ambiguity in atan direction ? ? ( ) , y ? + 180? atan2 x ? ?
Example dz = 30 + * 8 + + + (a 2d g) - (c 2f i) a b c dx x_mesh_spa cing 80 74 63 + + + + 80 ( 2 * 69 60 ) ( 63 2 * 56 48 ) = d e f 145.2o 8 * 30 69 67 56 = . 0 229 + g h i i) + 2b + + dz (g 2h - (a c) 60 52 48 = dy y_mesh_sp * 8 + acing + + + ( 60 2 * 52 48 ) 80 ( 2 * 74 63 ) = = + 8 * 30 2 2 Slope . 0 229 . 0 329 = . 0 329 = . 0 401 = o atan . 0 ( 401 ) 21 8 . + o 180 . 0 229 = = o Aspect atan 34 8 . o 145 2 . . 0 329
Hydrologic (D8) Slope (Flow Direction Tool) - Direction of Steepest Descent 30 30 80 74 63 80 74 63 69 67 56 69 67 56 60 52 48 60 52 48 67 48 67 52 = Slope: . 0 45 = . 0 50 30 2 30
Eight Direction (D8) Pour Point Model 32 64 128 16 1 8 4 2 ESRI Direction encoding
The D Algorithm Steepest direction downslope Proportion flowing to neighboring grid cell 3 is 2/( 1+ 2) Proportion flowing to neighboring grid cell 4 is 1/( 1+ 2) 3 2 4 2 1 Flow direction. 1 5 8 6 7 Tarboton, D. G., (1997), "A New Method for the Determination of Flow Directions and Contributing Areas in Grid Digital Elevation Models," Water Resources Research, 33(2): 309-319.) (http://www.engineering.usu.edu/cee/faculty/dtarb/dinf.pdf)
The D Algorithm Steepest direction downslope z0 Elevations at each vertex zi z2 z1 3 2 4 2 z z = atan 1 2 1 0 1 z z 1 5 0 1 2 2 z z z z 8 = + 0 1 S 1 2 6 7 If 1 does not fit within the triangle the angle is chosen along the steepest edge or diagonal resulting in a slope and direction equivalent to D8
D Example 30 z z 80 74 63 = 7 8 atan 1 z z 0 7 eo 52 48 69 67 56 = = o atan 14 9 . 67 52 e8 e7 60 52 48 2 2 52 48 67 52 284.9o = + S 30 30 14.9o = . 0 517
Summary Concepts Grid (raster) data structures represent surfaces as an array of grid cells Raster calculation involves algebraic like operations on grids Interpolation and Generalization is an inherent part of the raster data representation Watershed average precipitation may be computed by interpolation from point gages
Summary Concepts (2) The elevation surface represented by a grid digital elevation model is used to derive slope important for surface flow The eight direction pour point model approximates the surface flow using eight discrete grid directions. The D vector surface flow model approximates the surface flow as a flow vector from each grid cell apportioned between down slope grid cells.


")
")


 Slope (Flow Direction Tool)")
 Pour Point Model")


")