Global Beer Market Insights: Branding, Performance, and Trends
Explore the dynamics of the global beer market, including branding strategies, performance metrics, and emerging trends. Discover insights on increasing market share for lager beer, income elasticities, regional market analysis, and more. Uncover key information on standard lager, premium lager, ales, stouts, specialty beers, and low alcohol beers. Gain valuable knowledge for understanding the world of beer consumption and pricing trends in different regions.

Download Presentation

Please find below an Image/Link to download the presentation.
The content on the website is provided AS IS for your information and personal use only. It may not be sold, licensed, or shared on other websites without obtaining consent from the author. If you encounter any issues during the download, it is possible that the publisher has removed the file from their server.
You are allowed to download the files provided on this website for personal or commercial use, subject to the condition that they are used lawfully. All files are the property of their respective owners.
The content on the website is provided AS IS for your information and personal use only. It may not be sold, licensed, or shared on other websites without obtaining consent from the author.
E N D
Presentation Transcript
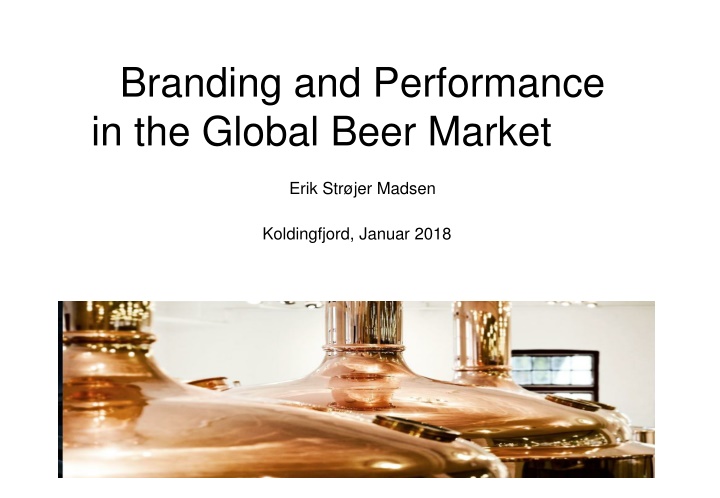
Branding and Performance in the Global Beer Market Erik Str jer Madsen Koldingfjord, Januar 2018
Take away Increasing global market share for the lager beer High income elasticities of lager beer in developing countries High price premium on premium lager M&A strategies motivated by the growth of premium lager
World market for beer Quantity consumed (Bill liter) Value of consumption (Bill USD) Type of beers 2016 Freq. 2016 % 2000-16 2016 Freq. 2016 % 2000-16 Standard lager 139.7 73.4 55.6 335.8 59.1 53.9 Premium lager 30.6 16.1 31.8 143.8 25.3 45.1 Ales and stouts 5.7 3.0 14.6 23.7 4.2 16.2 Specialty beers 9.0 4.7 27.8 47.4 8.3 42.8 Low alcohol beers 5.3 2.8 108.0 18.0 3.2 110.9 Total beer cons. 190.3 100.0 49.2 568.7 100.0 50.0 Increasing market share for Lager beer No inflation in beer prices
Regional markets Number of Standard lager Premium lager Specialty beers % 2000-16 World regions Countries 2016 % 2000-16 2016 % 2000-16 2016 Africa & M. E. 5 4.6 51.5 0.7 29.6 0.2 32.3 Asia 14 72.9 130.9 7.3 78.2 0.4 69.4 South America 5 24.5 45.0 1.5 233.7 0.6 95.6 North America 2 12.9 0.8 7.9 -3.2 4.6 15.8 West Europe 16 13.0 -23.3 6.9 0.0 2.5 19.3 East Europe 5 11.9 37.6 6.3 103.8 0.7 56.8 All countries 47 139.7 55.6 30.6 31.8 9.0 27.8 Note: Consumption measured in billions of liters. Increasing market share for Lager beer in developing countries
Income elasticities Log (Tijk) = + k Log (Gij) + k (Log (Gij))2 + k Xij + j + ijk Tijk Type k beer in country j, year i Gij GDP year i for country j Xij Controlling variables j Country fixed effects
Income elasticities Model 1 Model 2 Model 3 Pooled OLS Fixed effects Fixed effects Type of beers k k k k Standard lager 0.659 0.220 3.297 -0.169 Premium lager 1.140 0.422 3.086 -0.144 Ales and stouts 1.435 0.109 1.423 -0.071 Specialty beers 1.650 0.288 0.020+ 0.015+ Low alcohol beers 1.407 0.226 0.731+ -0.027+ Total beer cons. 0.764 0.247 2.791 -0.138 High and decreasing elasticity for premium lager Constant elasticity for specialty and low alcohol beer
Average price of beer Low Standard Premium Specialty Ales and Total beer alcohol World regions lager lager beers stouts cons. beers Africa & M. E. 2.22 2.46 5.34 2.14 2.01 2.35 Asia South America North America West Europe East Europe 2.10 2.09 2.51 4.93 2.14 4.53 2.58 4.28 6.74 3.95 5.14 2.64 5.39 6.52 2.51 6.76 2.06 3.70 5.81 1.90 3.23 2.29 3.70 4.48 2.07 2.38 2.13 3.58 5.61 2.71 All countries 2.40 4.70 5.29 4.14 3.41 2.99 High price premium for premium lager beer
Price premiums 140 120 100 % Price premium Premium beer 80 Specialty beer 60 Ails and stout 40 Low alcohol 20 0 2005 2000 2001 2002 2003 2004 2006 2007 2008 Year 2009 2010 2011 2012 2013 2014 2015 2016
Premiumization of the market Results of blind test experiments for lager beers No real differences in quality or taste Large perceived differences in branded beers Results: Branding competitions Investment in sales promotions and advertising
Premiumization of the market Vertical product differences? NO! Known technology with same raw material Blind test experiments for lager beers: Almenberg et al: Triangle test of Czechvar, Heineken and Stella Artios Result: The only one different could not be pointed out (Only 33%) Horizontal product differences? YES Blind test experiments for lager beers: McConnell: Same beer with 3 labels of popular, premium and super-premium Result: Panel ranked high priced beer higher in quality Consumer perceived the quality of beer by price signals
8 large breweries World Market share Billion USD 2012 2012 0.195 5.250 0.117 0.101 1.350 0.054 1.238 0.041 1.126 0.032 2.904 0.038 0.449 0.034 0.157 Marketing & sales expenses Marketing and sales cost Share of revenue Company AB Inbev SAB Miller Heineken Carlsberg Molson Coors Kirin Tsing Tao Yanjing 2002 0.188 2012 0.132 0.154 0.201 0.280 0.192 0.162 0.122 0.183 0.288 0.134 0.153 0.077 0.104 Total Average 0.612 0.077 12.481 0.179 0.159
Concentration and performance 70 60 50 40 % share Marketing share Market share 30 Ebit share 20 10 0 2002 2003 2004 2005 2006 2007 2008 2009 2010 2011 2012
Development in premiums Price premium increases % 2000-2016 Total premium increases % 2000-2016 Premium lager Billion USD Price premium Percent Size of premium Billion USD World regions Africa & M. E. 1.7 10.7 -2.74 0.16 27.4 Asia 33.2 106.1 4.59 17.81 84.52 South America 4.0 23.6 -9.54 0.76 153.2 North America 33.6 70.2 16.36 13.90 48.2 West Europe 46.2 36.9 -7.14 12.44 -7.8 East Europe 25.2 84.4 17.29 11.52 375.6 All countries 143.8 95.8 11.25 56.56 64.5 High competition in Western Europe for lager beer Asia has the most profitable market for Lager beer
Conclusions High income elasticities in developing countries High price premium on premium lager M&A strategies motivated by growth of premium lager
Thank you for your time! Questions? Time flies. You're the pilot.