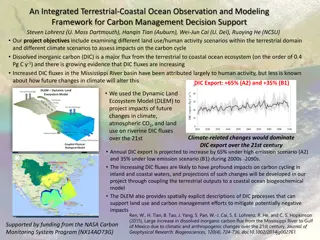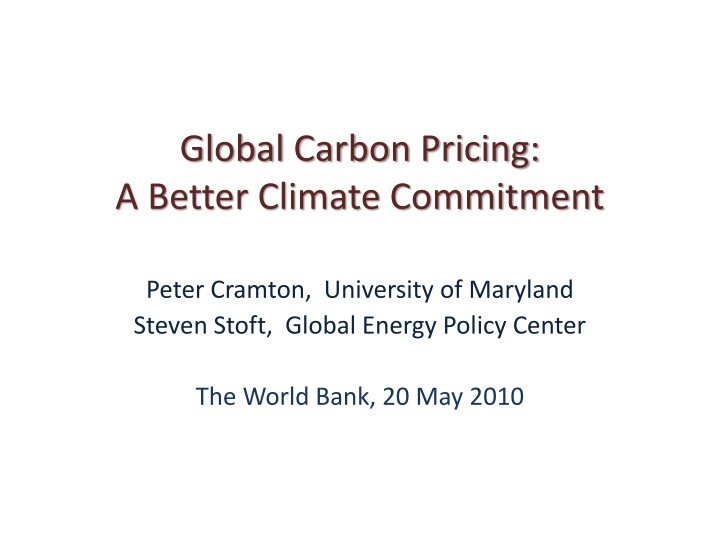
Global Carbon Pricing: A Better Climate Commitment
Roadmap to global cooperation in addressing climate change through carbon pricing; discussing international agreements, the Copenhagen Accord, commitments by countries like China and India, and the theory of cooperation in the cap-and-trade game.

Download Presentation

Please find below an Image/Link to download the presentation.
The content on the website is provided AS IS for your information and personal use only. It may not be sold, licensed, or shared on other websites without obtaining consent from the author. If you encounter any issues during the download, it is possible that the publisher has removed the file from their server.
You are allowed to download the files provided on this website for personal or commercial use, subject to the condition that they are used lawfully. All files are the property of their respective owners.
The content on the website is provided AS IS for your information and personal use only. It may not be sold, licensed, or shared on other websites without obtaining consent from the author.
E N D
Presentation Transcript
Global Carbon Pricing: A Better Climate Commitment Peter Cramton, University of Maryland Steven Stoft, Global Energy Policy Center The World Bank, 20 May 2010
Roadmap to Global Cooperation 1. Avoid cap-or-tax fight 2. Avoid problems of Copenhagen 3. Replace cap & trade game with pricing + green fund 4. How price commitment works 5. Cheap & effective 6. Oil security, China and climate 1
(1) Not the Cap-or-Tax Fight INTERNATIONAL AGREEMENT 2
Pricing Is Not Taxing Under Global Carbon Pricing Every country could use cap and trade With no carbon taxes anywhere !! Or countries can use any mix of cap, tax & feebate they want. International commitment National policy 3
What Do We Want in a Commitment? 1. Make cooperation easy 2. An easy path to stronger commitments 4
(2) COPENHAGEN 5
The Copenhagen Accord: China China will endeavor to lower its carbon dioxide emissions per unit of GDP by 40-45% by 2020 compared to the 2005 level. DOE (May 2009) estimated 45% Previous 15 years China cut intensity 44.4% So, 45% is Business as Usual http://www.global-energy.org/lib/2009/09-08 7
Copenhagen Accord: India India committed to doing half as well as business as usual Other developing countries commit to nothing and want subsidies 8
Developed Countries All commit to more Europe and Japan commit to much more Everyone agrees there was a polarization of rich and poor countries, starting at Kyoto and now much worse Why? 9
(3) A Theory of Cooperation THE CAP-AND-TRADE GAME 10
Roadmap to Games Public Goods game Cooperation problems If abate 50% is best U.S. self-interest abate 10% Canadian self abate 1% So, change the game to cap & trade ? U.S. self-interest target 17% (buy 9% abroad) Canadian self target 6% (sell C permits) So, change the game to Pricing + Green Fund Self-interest of all PT that s just right (strong) 11
First: The Public-Goods Game Country i picks an Abatement level, Ai To maximize its net benefit = benefit from all abatement minus its own abatement cost Even big countries choose an Ai that is about five times too low 12
The Cap-and-Trade Game 1. Countries pick a Target level, Ti 2. Maximize the same net benefit minus the cost of carbon permits for Ti Ai How does their target, Ti, compare with their abatement, Ai, in public-goods game? 13
Polarization Theorem Identical countries Ti = Ai Targets = Abatement in public-goods game Different size countries Polarization Ti > Ai for big countries Ti< Aifor small countries Also, there is less total abatement 14
Rich-Poor Polarization Cap and trade causes Rich-Poor polarization Intuition 1. Trade all face the same price of carbon 2. High abaters think it s cheap (and do more) 3. Low abaters think it s expensive (and do less) We can do better with Global Carbon Pricing & Green Fund 15
An Example World Suppose $30/ton carbon price is optimal e = emissions/capita avg(e) = world average low-e e is less than average Low-e countries (India) see abatement costs and green funds amplified by avg(e)/e 16
The Green-Fund Treaty 1. Countries vote (name a Pi) for global price 2. PT = the lowest price named 3. Countries pay G (above average emissions) Countries receive G (below avg emissions) 4. G = 0.036 PT ( G = $1.10/ton if PT = $30/ton ) So what PT will countries vote for? 17
Three Country Example Country Voted P P* Benefit Cost G.F. e Ton/cap. $/ton $/ton $/capita/year U.S. 18 $26 $26 $28 $12 $4 China 5 $30 $26 $31 $14 $0 India 1.1 $26 $26 $6 $2 $4 $26 is very close to optimal ($30) Poorest countries gain even without climate benefits ! 18
Our Proposal Adds: Green Fund rewards low-e countries for achieving PT Carbon-revenue trading to allow flexibility G decided politically 19
(4)For a Better Commitment FLEXIBLE GLOBAL CARBON PRICING 20
The Problems: Perverse Incentives 1. Caps are risky and unfair 2. Poor countries paid not to commit ( with CDM projects ) 3. There is no enforcement 4. Polarizing incentives 5. 100 unique commitments 21
A Cap Is Risky US wants China to cap itself below its trend line In 2000, its trend line pointed to 3.5B tons in 2010 It's BAU turned out to be above 7.0B tons Commitment to this cap would have meant buying 3.5B permits on the world market for ~ $100B Committing to a price would mean collecting and keeping $100B in carbon revenue 22
Caps Appear Unfair If India accepted a trend line cap, it would be capped at under 1.5 tons/person That is less than the US emitted in 1880 Why should India be capped so low just because others have emitted so much? 23
Pricing Overview Two global parameters Global carbon price target = PT~ $30/ton Global Green-Fund price = G ~ $2/ton (Clean Development Incentive, CDI) G High-e Countries Low-e Countries PT PT e = the country's emissions / person 24
Rule #1: National Policy Flexibility Every country could use cap and trade, But carbon taxes or a mix are fine 25
Rule #2: Carbon Price Flexibility What if you don't meet the global price target? What if you exceed it? Buy/Sell carbon-revenue credits from another country, through acentral market Target revenue: R* = Emissions PT The country must pay Z (R* R), where Z 10% 26
#3: Hitting the Carbon Price Target Higher Z Higher global carbon revenues Global Average Price = (total revenues) / (total emissions) Adjust Z annually to make Global Average Price = PT 27
#4: Green Fund Payments (example) World average emissions, avg(e) 5 tons/capita/year Consider a country with e = 10 tons/capita/yr Assume G = $2/ton The country pays (e avg(e)) G (10 5) $2 = $10/capita/yr A country emitting 1 ton/cap/yr would receive (1 5) $2 = $8/capita/yr 28
#5: The Green-Fund Incentive It replaces the CDM It rewards cooperation If a country s carbon price, P, is less than PT its GF payment is scaled back by P / PT It also rewards information and research programs that are missed by carbon pricing 29
What Counts as Carbon Pricing? 1. Carbon permits used under cap and trade 2. Any tax on fossil fuels 3. Feebates. E.g. $1/ton of lifetime auto emissions But not subsidies or command and control policies 30
(5) Why Price Carbon? CHEAP AND EFFECTIVE 31
OPEC: The Best and Worst Climate Policy Ever 6 $ Trillions 6 U.S. GDP GT 5 5 U.S. CO2 4 4 with Nuclear assumed to be Coal 3 3 2 2 1960 1973 1986 32
U.S. EPA: Carbon Pricing Is Cheap Abatement Cost = Price Abatement The is because sensible abatements cost between $0 and the price of carbon For several reasons this is likely too high 33
Example: PT = $30/t, G = $2/t Starting Emissions per Capita (tons/year) Green Fund Cost Abatement Costs ( cents / person / day ) 0.8 Total Cost 1.7 0.9 1 India 4.1 0.0 4.1 5 Average Country 16.4 6.6 23.0 20 United States Assumes emissions reduced by 20% from values shown. China is close to average. 34
(7) The U.S. and China OIL SECURITY AND CLIMATE 35
The Oil-Climate Alignment GHG emissions Using less oil reduces: World price of oil Half of IEA's purpose: Half of Kyoto's purpose: To reduce oil use 36
How Strong Is the Effect? MIT on caps: oil price down 34 47% in 2050 IEA on a tight-oil market: A 1% cut in use a 9% cut in price Six models, including DOE, found at least: A 1% cut in use a 1.5% cut in price 37
Whats It Worth to Save a Barrel? Cut oil use by 1 barrel when price = $100 That saves $100 And reduces the cost of all other barrels Enough to save $150 Is this a free lunch? No, it s OPEC s lunch 38
We Need an Oil Consumers' Cartel The immediate objective [of the IEA] is the consumers counter-cartel. New York Times, 1974 the Tokyo [G7] agreementamounts to a consumers cartel. New York Times, 1979 39
It Could Pay for Climate Policy 20% Decrease in oil demand by cartel 67% Of world oil use covered China Imported-oil savings $49 B/year Climate-policy cost $33 B/year U.S. Imported-oil savings $41 B/year Climate-policy cost $25 B/year 40
Conclusion 1. Carbon Pricing is designed for cooperation 2. It does not cap India and China 3. One price target, not 100 caps 4. No offset payments to not cooperate 5. Green Fund rewards (1) setting a high target, and (2) meeting that target 41
Conclusion 6. It s easier to comply with ( Anyone can tax gasoline ) 7. It s easier to enforce ( Checkups at end of every year ) 8. Oil savings brings immediate benefits ( Not distant and uncertain benefits ) 42


 Not the Cap-or-Tax Fight")


")


 A Theory of Cooperation")


For a Better Commitment")


")


 Why Price Carbon?")


 The U.S. and China")