Global Corrections Performance Measures: Lessons from Australia
Explore the development of global corrections performance measures with insights from Australia, focusing on high-quality research, evidence-based policies, and a performance indicator framework including equity considerations for correctional programs.

Download Presentation

Please find below an Image/Link to download the presentation.
The content on the website is provided AS IS for your information and personal use only. It may not be sold, licensed, or shared on other websites without obtaining consent from the author.If you encounter any issues during the download, it is possible that the publisher has removed the file from their server.
You are allowed to download the files provided on this website for personal or commercial use, subject to the condition that they are used lawfully. All files are the property of their respective owners.
The content on the website is provided AS IS for your information and personal use only. It may not be sold, licensed, or shared on other websites without obtaining consent from the author.
E N D
Presentation Transcript
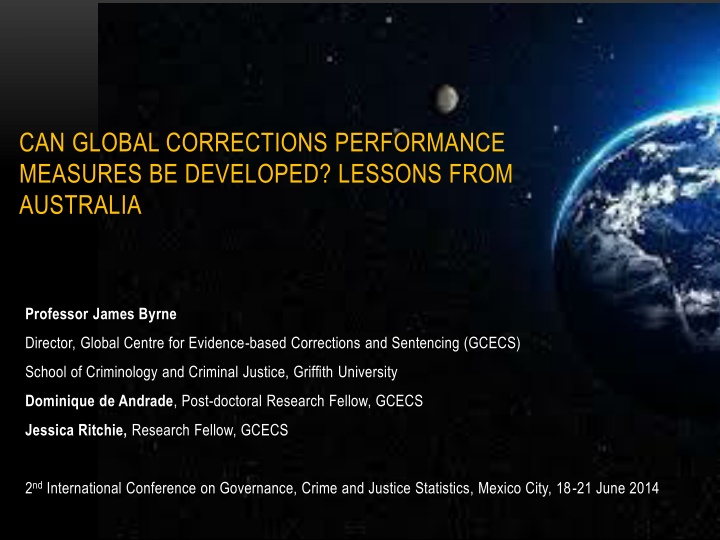
CAN GLOBAL CORRECTIONS PERFORMANCE MEASURES BE DEVELOPED? LESSONS FROM AUSTRALIA Professor James Byrne Director, Global Centre for Evidence-based Corrections and Sentencing (GCECS) School of Criminology and Criminal Justice, Griffith University Dominique de Andrade, Post-doctoral Research Fellow, GCECS Jessica Ritchie, Research Fellow, GCECS 2ndInternational Conference on Governance, Crime and Justice Statistics, Mexico City, 18-21 June 2014
(1) High Quality Corrections and Sentencing Research Agenda- the Centre will develop research projects focusing on evaluating the impact of current corrections and sentencing strategies (adult/juvenile) in Queensland, throughout Australia, and internationally. (2) Knowledge Exchange Seminars and Systematic, Evidence -based Policy Reviews -To translate research into practice, the Centre will develop a series of executive session seminars and workshops highlighting corrections and sentencing issues in each global region. (3) Global Evidence-based Corrections and Sentencing Network Development: The Centre through the Centre s state of the art website-- will become a global clearinghouse for high quality, evidence-based corrections research, and a primary source of information on global corrections performance, and innovative corrections and sentencing policies and practices. WEBPAGE: WWW.GCECS.EDU.AU
BALANCING EFFICIENCY & EFFECTIVENESS If you don t define what performance is, then someone else will define it for you. Case in point: Lets look at the Performance Measures for Australian Corrections included in the recent review: Government Services 2013 In Australia, corrections performance is monitored across the eight Australian States/territories in the following areas: Efficiency, Equity, Outputs, and Outcomes Utilizing these data elements, an overall performance ranking of each Australian state/territory s corrections system is possible.
EQUITY AS A PERFORMANCE MEASURE Indicator of Access to Appropriate Correctional Programs/Services (not developed yet) Likely measures would compare access for male and female offenders in prison or under community supervision In addition, age-appropriate, culture-appropriate, and problem- appropriate program placements would be reviewed. It is also possible that measures of procedural justice will be developed to gauge system responsiveness to prisoner and staff grievances.
CORRECTIONAL SERVICES EFFECTIVENESS MEASURES OUTPUTS OUTCOMES Assaults in custody Escapes Apparent unnatural deaths Completion of community orders Time out of cells Employment Community work Education Offence related programs (undefined)
MODIFIED CORRECTIONAL SERVICES EFFECTIVENESS MEASURES OUTPUTS OUTCOMES Assaults in custody Assaults in custody Apparent unnatural deaths Apparent unnatural deaths Time out of cells Escapes Employment Completion of community orders Community work Recidivism: Education Prison Offence related programs (undefined) Community corrections
EFFICIENCY AS A PERFORMANCE MEASURE Cost per prisoner/offender Total net operating expenditure and capital costs per prisoner/offender per day. Offender to staff ratio Daily average number of offenders divided by the number of fulltime (equivalent) staff employed in community corrections. Prison utilization Extent to which prison design capacity meets demand for prison accommodation. Total daily average prisoner population divided by average prison design capacity.
KEY FINDINGS FROM THIS REVIEW Can global performance be measured? 1. There is a relationship between efficiency and effectiveness: high efficiency = low overall effectiveness. 2. Performance rankings for corrections systems can be developed. 3. The challenge will be the development of accurate evidence- based performance measures. 4. The Lesson learned from Australia s performance review : What gets measured, gets done. 5. Lets take a look at both the overall performance rankings and the recidivism rates across Australia
REVISED OVERALL PERFORMANCE RANKING (INCLUDES RECIDIVISM) Efficiency Output Outcome Overall rank NSW 2 7 4 4 VIC 7 2 8 7 QLD 1 4 3 1 WA 8 1 7 6 SA 4 6 2 3 TAS 2 8 5 5 ACT 5 3 1 2 NT 6 5 6 7
AUSTRALIAN OPERATIONAL DEFINITION OF RECIDIVISM The percentage of prisoners released during 2010-11 following a term of sentenced imprisonment, who returned to corrective services (prison or community corrections) with a new correctional sanction within two years. Includes prisoners subject to correctional supervision following release (i.e. released on parole or other community corrections orders). Includes returns to prison resulting from the cancellation of a parole order.
TWO YEAR POST-RELEASE RECIDIVISM Prisoners return to Prison Offenders returning to Community correction 12% (3) 16% (5) 16% (6) 10% (2) 16% (4) 20% (8) 17% (7) 7% (1) Corrective services 48% (5) 45% (4) 44% (3) 43% (2) 41% (1) 51% (5) 58% (7) 58% (7) Corrective services 22% (3) 22% (4) 34% (8) 14% (1) 24% (5) 25% (6) 19% (2) 26% (7) NSW VIC QLD WA SA TAS ACT NT 48% (6) 37% (3) 38% (4) 36% (2) 29% (1) 39% (5) 47% (7) 58% (8)
CONCLUDING COMMENTS The big question: Can global sentencing and corrections performance measures be developed? We think that the answer is yes, but to date, we know little about global corrections performance beyond global comparisons of country level incarceration rates. We need to begin the task of collecting the necessary data to allow the identification of high performance and low performance institutional and community corrections across countries and global regions
PRE TRIAL DETAINEES AND REMAND RATE PER 100,000 OF NATIONAL POPULATION
GLOBAL COMPARISON OF THE USE OF PRISON Countries with high rates of prison use Countries with Low rates of prison use USA ( 716 per 100,000) San Marino ( 6 per 100,000) Seychelles (709 per 100,000) Faeroe Islands (17 per 100,000) St. Kitts and Nevis (701 per 100,000) Central African Republic (19 per 100,000) Virgin Islands, USA (539 per 100,000) Comoros ( 19 per 100,000) Cuba ( 510 per 100,000) Liechtenstein (24 per 100,000) Rwanda (492 per 100,000) Anguilla, UK (487 per 100,000) Russian Federation (479 per 100,000) Belize (476 per 100,000)
Contact information Professor James Byrne James.Byrne@griffith.edu.au

 High Quality Corrections and Sentencing Research Agenda-")