Global Media Usage & Exposure Forecast 2015-2019 Report Insights
Explore essential strategic intelligence on global consumer media usage and exposure forecasts from 2015 to 2019. Dive into data analytics by country, media sector, platform, and social generations, covering 15 leading countries, 2 major sectors, and 11 media silos. Discover trends in digital and traditional media platforms, demographics, and leading markets. Gain insights into total media usage growth, digital trends, and the dominance of television consumption.
Download Presentation

Please find below an Image/Link to download the presentation.
The content on the website is provided AS IS for your information and personal use only. It may not be sold, licensed, or shared on other websites without obtaining consent from the author. If you encounter any issues during the download, it is possible that the publisher has removed the file from their server.
You are allowed to download the files provided on this website for personal or commercial use, subject to the condition that they are used lawfully. All files are the property of their respective owners.
The content on the website is provided AS IS for your information and personal use only. It may not be sold, licensed, or shared on other websites without obtaining consent from the author.
E N D
Presentation Transcript
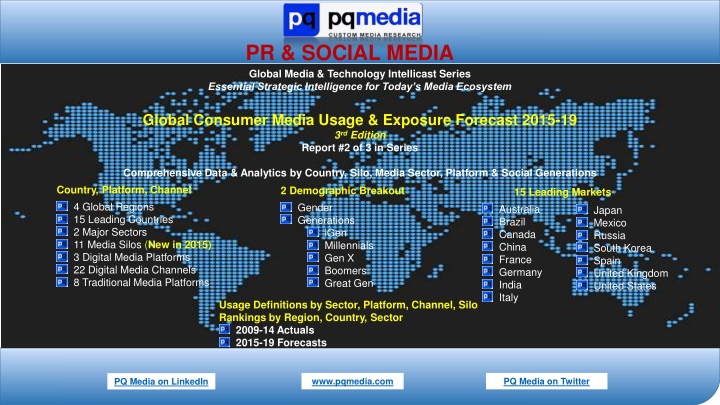
PR & SOCIAL MEDIA Global Media & Technology Intellicast Series Essential Strategic Intelligence for Today s Media Ecosystem Global Consumer Media Usage & Exposure Forecast 2015-19 3rd Edition Report #2 of 3 in Series Comprehensive Data & Analytics by Country, Silo, Media Sector, Platform & Social Generations Country, Platform, Channel 4 Global Regions 15 Leading Countries 2 Major Sectors 11 Media Silos (New in 2015) 3 Digital Media Platforms 22 Digital Media Channels 8 Traditional Media Platforms Great Gen 2 Demographic Breakout Gender Generations iGen Millennials Gen X Boomers 15 Leading Markets Australia Brazil Canada China France Germany India Italy Japan Mexico Russia South Korea Spain United Kingdom United States Usage Definitions by Sector, Platform, Channel, Silo Rankings by Region, Country, Sector 2009-14 Actuals 2015-19 Forecasts www.pqmedia.com PQ Media on Twitter PQ Media on LinkedIn
Global Consumer Media Usage & Exposure Forecast 2015 Global 2 www.pqmedia.com www.pqmedia.com
Total Global Media Usage & Exposure Rose 2.6% in 2014 to 45.0 Hours Per Week Projected to Post 2% CAGR Gain to 49.7 Hours Per Week in 2019 60 3% Total Media Usage & Exposure (Hours Per Week) 49.7 Total Media Usage & Exposure Growth 45.0 Hours Per Week 40.2 % Growth 40 2% 20 1% 0 0% 2009 10 11 12 13 14 15 16 17 18 2019 Source: PQ Media 3 www.pqmedia.com
Digital Represents 14.1% Share of Total Usage in 2014 Men Use Digital More than Women; I-Gen Highest Digital Users at Almost 22% Share Women Total Men 13.4% 14.1% 14.9% 85.1% 86.6% 85.9% i-Gen Great Gen Millennials Gen-X Boomers 10.0% 12.8% 16.8% 18.2% 21.8% 78.2% 81.8% 83.2% 87.2% 90.0% Traditional Usage Digital Usage 4 www.pqmedia.com
Consumers Use Television More than Any Other Media Silo at 24.6 Hours Per Week in 2014 Legacy Digital Media, Content Only Available on Digital Devices, Reached 2.4 HPW Total Media Usage & Exposure by Media Silos in 2014 Total Television Total Radio Total News & Information Total Legacy Internet Media (a) Total Out-of-Home Media Total Legacy Mobile Media (a) Total Videogames Total Periodicals & Serials Total Books & Directories Total Film & Home Video Total Music Hours Per Week 0 10 20 30 (a) Legacy Internet & Mobile Media are specific to channels and sites that are exclusively digital, such as online search and mobile marketing apps The digital brand extension of traditional media companies, such as videos placed on ESPN.com & ESPN Mobile, are included in the traditional media platform (e.g., TV). Additionally, all forms of the media platform, including pure-play digital companies are included in that platform, such as Huffington Post in News & Information 5 www.pqmedia.com
Digital Global Media Usage & Exposure Rose 12% in 2014 to 6.3 Hours Per Week Projected to Post 9.4% CAGR Gain to 9.9 Hours Per Week in 2019 12 20% Digial Media Usage & Exposure (Hours Per Week) 9.9 Digital Media Usage & Exposure Growth Hours Per Week 9 15% % Growth 6.3 6 10% 3.5 3 5% 0 0% 2009 10 11 12 13 14 15 16 17 18 2019 Source: PQ Media 6 www.pqmedia.com
Mobile Video Fastest Growing Digital Media Channel for Usage Up 33% in 2014 e-Commerce Slowest Growing of 22 Digital Media Usage & Exposure Channels Tracked at 0% Growth of Digital Media Channel Usage in 2014 Mobile Video Mobile Audio m-Books, Directories & Databases Mobile Periodicals & Serials Mobile Games Mobile News & Information Mobile Social Media Over-the-Top (OTT) Video Online Video Mobile Search & Texts e-Books, Directories & Databases m-Commerce & Other Content & Data Digital Out-of-Home Online Games Online Periodicals & Serials Online News & Information Online Social Media Satellite Radio Console, PC & Handheld Games Online Audio Online Search & E-Mails e-Commerce & Other Content & Data -10% 0% 10% 20% 30% 40% 7 www.pqmedia.com
Global Traditional Advertising & Marketing Revenues Rose 1.6% in 2014 to $739.0 Billion Projected to Post 2.7% CAGR to $844.1 Billion in 2019 $1,000 4% Traditional Advertising & Marketing Revenues Traditional Advertising & Marketing Growth $844.1 US$ Billions $739.0 $750 3% $680.9 % Growth $500 2% $250 1% $0 0% 2009 10 11 12 13 14 15 16 17 18 2019 Source: PQ Media 8 www.pqmedia.com
Global Economic Growth Has Been Sluggish, with Digital Usage Outpacing GDP by 10 Pct Pts As Digital Device Penetration Reaches Saturation in Developed Nations, Difference 3 Pts in 2019 20% 15% 10% 5% 0% 2010 11 12 13 14 15 16 17 18 2019 -5% Total Media Usage & Exposure Digital Media Usage & Exposure Traditional Media Usage & Exposure Nominal GDP Source: PQ Media 9 www.pqmedia.com
Japan Ranked First in Total Media Usage; China in Growth; South Korea in Digital Media Share US Ranked Fifth in Usage, 11th in Growth, and Third in Digital Media Share Total Media Usage & Exposure 2014 Usage & Exposure 2014 vs. 2013 Growth 2014 Share of Digital Media Japan China South Korea Germany Russia Australia Canada Brazil United States United Kingdom India United Kingdom United States South Korea France Source: PQ Media US ranked 11th in growth 10 www.pqmedia.com
Global Consumer Media Usage & Exposure Forecast 2015 United States 11 www.pqmedia.com www.pqmedia.com
Total US Media Usage & Exposure Rose 0.7% in 2014 to 64.7 Hours Per Week Projected to Post 0.7% CAGR Gain to 67.0 Hours Per Week in 2019 100 2% Total Media Usage & Exposure (Hours Per Week) Total Media Usage & Exposure Growth Hours Per Week 75 1% 67.0 % Growth 64.7 64.5 50 0% 25 -1% 0 -2% 2009 10 11 12 13 14 15 16 17 18 2019 Source: PQ Media 12 www.pqmedia.com
Digital Represents 25.9% Share of Total Usage in 2014 Men Use Digital More than Women; I-Gen Highest Digital Users at Almost 40% Share Women Total Men 24.4% 25.9% 27.4% 72.6% 74.1% 75.6% i-Gen Great Gen Millennials Gen-X Boomers 15.3% 21.7% 31.1% 32.8% 39.5% 60.5% 67.2% 68.9% 78.3% 84.7% Traditional Usage Digital Usage 13 www.pqmedia.com
Consumers Use Television More than Any Other Media Silo at 32.5 Hours Per Week in 2014 Legacy Digital Media, Content Only Available on Digital Devices, Reached 5.8 HPW Total Media Usage & Exposure by Media Silos in 2014 Total Television Total Radio Total Legacy Internet Media (a) Total News & Information Total Out-of-Home Media Total Videogames Total Books & Directories Total Periodicals & Serials Total Legacy Mobile Media (a) Total Film & Home Video Total Music Hours Per Week 0 10 20 30 40 (a) Legacy Internet & Mobile Media are specific to channels and sites that are exclusively digital, such as online search and mobile marketing apps The digital brand extension of traditional media companies, such as videos placed on ESPN.com & ESPN Mobile, are included in the traditional media platform (e.g., TV). Additionally, all forms of the media platform, including pure-play digital companies are included in that platform, such as Huffington Post in News & Information 14 www.pqmedia.com
Digital US Media Usage & Exposure Rose 9.6% in 2014 to 16.8 Hours Per Week Projected to Post 7.3% CAGR Gain to 23.9 Hours Per Week in 2019 30 12% Digial Media Usage & Exposure (Hours Per Week) Digital Media Usage & Exposure Growth 23.9 Hours Per Week % Growth 20 8% 16.8 11.1 10 4% 0 0% 2009 10 11 12 13 14 15 16 17 18 2019 Source: PQ Media 15 www.pqmedia.com
Mobile Audio Fastest Growing Digital Media Channel for Usage Up 41% in 2014 PC Usage for Search & E-Mail and e-Commerce Fell As Consumers Switch to Mobile Devices Growth of Digital Media Channel Usage in 2014 Mobile Audio Mobile Video m-Books, Directories & Databases Mobile Periodicals & Serials Mobile Games Mobile News & Information Mobile Social Media Mobile Search & Texts m-Commerce & Other Content & Data Online Video e-Books, Directories & Databases Online Games Over-the-Top (OTT) Video Online Periodicals & Serials Online News & Information Digital Out-of-Home Online Social Media Console, PC & Handheld Games Satellite Radio Online Audio Online Search & E-Mails e-Commerce & Other Content & Data -10% 0% 10% 20% 30% 40% 50% 16 www.pqmedia.com
Traditional US Media Usage & Exposure Fell 2.1% in 2014 to 47.9 Hours Per Week Projected to Post 2.1% CAGR Decline to 43.1 Hours Per Week in 2019 75 2% Traditional Media Usage & Exposure (Hours Per Week) Traditional Media Usage & Exposure Growth Hours Per Week 53.4 % Growth 47.9 50 0% 43.1 25 -2% 0 -4% 2009 10 11 12 13 14 15 16 17 18 2019 Source: PQ Media 17 www.pqmedia.com
US Digital Media Usage & Exposure Outpaces GDP Growth by 3-5 Points Overall and Traditional Media Usage Underperform Economic Growth by 2-6 Points 15% 10% 5% 0% 2010 11 12 13 14 15 16 17 18 2019 -5% Total Media Usage & Exposure Digital Media Usage & Exposure Traditional Media Usage & Exposure Nominal GDP Source: PQ Media 18 www.pqmedia.com
This is the second report of the three-part series in the PQ Media Global Media & Technology Forecast Intellicast Series. This series delivers the first holistic map of the media ecosystem. It is organized by country, medium, channel, device, generation and gender, covering more than 100 digital and traditional media channels and 15 leading global markets, including the US. The findings are comprehensive, data rich, and forms the foundation of essential media business intelligence. Click on any of the links below to visit PQ Media s Research Report webpage and download the free executive summaries of last year s reports The 2015 editions of the last report will be released later this year. Global Digital & Alternative Media Revenue Forecast 2014-18. Success in today s fast-changing media economy requires timely, accurate and actionable strategic intelligence. Let PQ Media help your organization move towards a successful digital media future with a free, no-obligation situation review. To schedule your review, please contact Patrick Quinn at pquinn@pqmedia.com or Dr. Leo Kivijarv at lkivijarv@pqmedia.com or call 203-569-9449. Global Consumer Media Usage & Exposure Forecast 2014-18. Global Consumer Spending on Media & Technology Forecast 2014-18. 19 www.pqmedia.com

