Global Stock Market Performance Insights
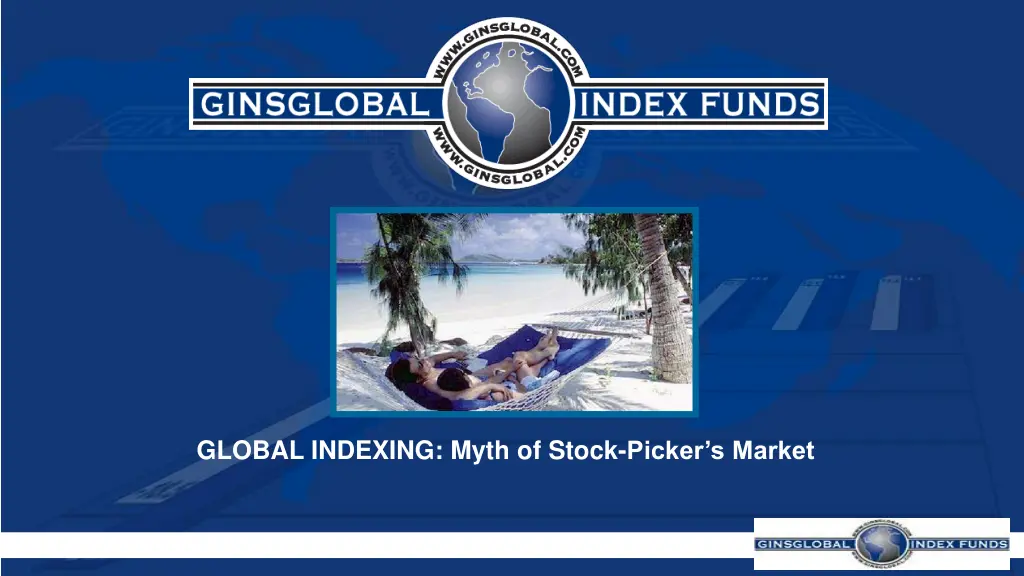
Gain insights into the global stock market performance, including the myth of stock-pickers, indexing advantages, and the underperformance of active fund managers in various regions. Explore data on how active fund managers stack up against indices, the impact of value vs. growth stocks, and the challenges faced by stock-pickers. Understand the significance of low-cost indexing and how it compares to active management strategies.
Download Presentation

Please find below an Image/Link to download the presentation.
The content on the website is provided AS IS for your information and personal use only. It may not be sold, licensed, or shared on other websites without obtaining consent from the author. If you encounter any issues during the download, it is possible that the publisher has removed the file from their server.
You are allowed to download the files provided on this website for personal or commercial use, subject to the condition that they are used lawfully. All files are the property of their respective owners.
The content on the website is provided AS IS for your information and personal use only. It may not be sold, licensed, or shared on other websites without obtaining consent from the author.
E N D
Presentation Transcript
BCI GinsGlobal Equity Index Fund MSCI World = core global building block. MSCI World = core global building block. 1,600+ Developed Market shares. 1,600+ Developed Market shares. AUM R1bn since April launch. (ZAR Fund) AUM R1bn since April launch. (ZAR Fund) State Street State Street - - Global Index Leader ($2.7 trillion) Global Index Leader ($2.7 trillion)
Myth of Stock-Pickers market >90% Global Active Managers underperform 5yr. >90% Global Active Managers underperform 5yr. Indexing Diversified: Core vs Explore. Indexing Diversified: Core vs Explore. Fund Manager Inconsistency. Fund Manager Inconsistency. Indexing = Low Cost (70bps+ head start). Indexing = Low Cost (70bps+ head start).
Bad 1st Qtr for Stock-Pickers Bearish; Value vs. Growth; Low Tech. Bearish; Value vs. Growth; Low Tech. 1/3 Active Large 1/3 Active Large- -Cap US Funds beat Index 2023. Cap US Funds beat Index 2023. Worst performance in 3yrs. Worst performance in 3yrs. ( Bank of America) Apple, Microsoft & Nvidia = 50% of S&P 500 gain. Apple, Microsoft & Nvidia = 50% of S&P 500 gain. Reminder of past decade Reminder of past decade - - poor Active vs Indexing. Hurt by Financial & Energy stocks. Hurt by Financial & Energy stocks. ( Bank of America) poor Active vs Indexing.
% SA Fund Managers Underperforming 1yr 3yr 5yr 10yr 68.7% 93.7% 96.5% 96.4% Global (vs. S&P Global 1200)* 60.5% 85.4% 91.4% 92.8% SA Equity (vs. S&P SA 50) * The 75th Percentile Performing Fund (top 25%) failed to outperform S&P Global Index in each period. Source: Standard & Poors, Year-End 2022 SPIVA Scorecard (South Africa)
% European & UK Fund Managers Global Index Underperformance YTD 1yr 3yr 5yr 10yr 79.5% 79.4% 90.6% 94.6% 98.0% Global Funds (in Euros) (vs. S&P Global 1200) 74.9% 73.3% 86.1% 89.1% 92.8% Global Funds (in ) (vs. S&P Global 1200) Source: Standard & Poors, Year-End 2022 SPIVA Scorecard (Europe)
Global Index Underperformance US Fund Managers 1 year 3 year 5 year 10 year 20 year 69.1% 83.8% 83.0% 89.1% 88.5% Global (incl US) (vs. S&P Global 1200) 68.4% 76.7% 80.8% 86.5% 93.5% Global (ex US) (vs. S&P 700) 60.0% 50.6% 63.2% 69.0% 84.9% Global Small Cap (vs. S&P Developed) 75.8% 74.5% 78.6% 85.3% 97.0% Emerging Markets (vs. S&P/IFCI Composite) Source: Standard & Poors, Year-End 2022 SPIVA Scorecard
S&P % US Fund Managers underperforming S&P % US Fund Managers underperforming
% US Fund Managers underperforming 1 year 3 year 5 year 10 year 20 year 51.1% 74.3% 86.5% 91.4% 94.8% Large-cap (vs. S&P 500) Medium-cap (vs. S&P 400) Small-cap (vs. S&P 600) All US Equity (vs. S&P 1500) 62.6% 78.0% 64.8% 81.5% 94.0% 56.9% 66.9% 70.5% 89.1% 93.7% 50.3% 78.7% 88.0% 93.1% 92.1% Source: Standard & Poors, Year-End 2022 SPIVA Scorecard
GLOBAL INDEXING beats ACTIVE % Active Funds beating Passives Source: AJ Bell, Morningstar. Data to 30/6/22 (UK) IA Sector (UK) First half 2022 Last 5 years Last 10 years 2021 Asia Pacific ex-Japan 27% 47% 59% 26% Europe ex-UK 49% 46% 57% 53% Global (MSCI World) 31% 26% 28% 25% Global Emerging Markets 21% 37% 42% 50% Japan 40% 43% 51% 4% North America 40% 25% 28% 19% UK All Companies 12% 31% 63% 41% Total 30% 33% 45% 34%
Conclusion Myth of Stock Myth of Stock- -Picker s market. Picker s market. Most Active Managers underperform. Most Active Managers underperform. Indexing Diversified: Core vs Explore. Indexing Diversified: Core vs Explore. State Street State Street Global Index Leader. Global Index Leader. Indexing = Low Cost. Indexing = Low Cost.
Disclaimer: Collective Investment Schemes in securities are generally medium to long term investments. The value of participatory interests may go up or down and past performance is not necessarily an indication of future performance. The Manager does not guarantee the capital or the return of a portfolio. Collective Investments are traded at ruling prices and can engage in borrowing and scrip lending. A schedule of fees, charges and maximum commissions is available on request. The manager reserves the right to close the portfolio to new investors and reopen certain portfolios from time to time in order to manage them more efficiently. Additional information, including application forms, annual or quarterly reports can be obtained from the manager, free of charge. This is a Section 65 approved fund under the Collective Investment Schemes Control Act 45, 2002 (CISCA). Boutique Collective Investments (RF) (Pty) Ltd is the South African Representative Office for this fund. Boutique Collective Investments (RF) (Pty) Ltd is registered and approved under the Collective Investment Schemes Control Act (No.45 of 2002

