Global Trade Analysis Project: Data, Models, and Research at Purdue University
The Global Trade Analysis Project (GTAP) at Purdue University focuses on quantitative analysis of global economic issues, utilizing publicly available data and models. The project aims to provide a comprehensive database for policy analysis, with global coverage and continuous updates to ensure relevance and reliability. Learn about GTAP's motivation, structure, database, and data principles in this overview.
Uploaded on | 8 Views
Download Presentation

Please find below an Image/Link to download the presentation.
The content on the website is provided AS IS for your information and personal use only. It may not be sold, licensed, or shared on other websites without obtaining consent from the author. If you encounter any issues during the download, it is possible that the publisher has removed the file from their server.
You are allowed to download the files provided on this website for personal or commercial use, subject to the condition that they are used lawfully. All files are the property of their respective owners.
The content on the website is provided AS IS for your information and personal use only. It may not be sold, licensed, or shared on other websites without obtaining consent from the author.
E N D
Presentation Transcript
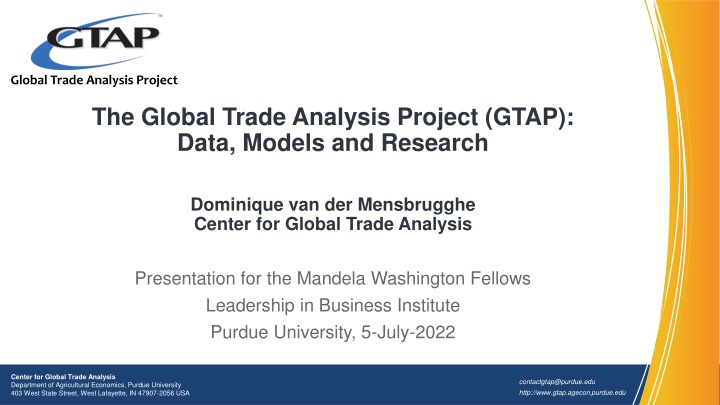
Global Trade Analysis Project The Global Trade Analysis Project (GTAP): Data, Models and Research Dominique van der Mensbrugghe Center for Global Trade Analysis Presentation for the Mandela Washington Fellows Leadership in Business Institute Purdue University, 5-July-2022 Center for Global Trade Analysis Department of Agricultural Economics, Purdue University 403 West State Street, West Lafayette, IN 47907-2056 USA contactgtap@purdue.edu http://www.gtap.agecon.purdue.edu
Outline Introductions What is GTAP GTAP and AfCFTA 2
Motivation for GTAP Increasing demand for quantitative demand of global economic issues E.g. EU integration, WTO accession (China and Russia), Trump trade war, AfCFTA Paris agreement to limit global GHG emissions Historically analysis was done: in-house in a few agencies: OECD, World Bank, etc., and No continuity, priorities change constantly, limited quality control At a few university research centers Limited funding, rent-seeking 3
Thus begat GTAP Combines the advantages of both approaches Publicly funded project: Based in academia (Purdue University, Center for Global Trade Analysis) Supports a global economic database and model which are: fully documented; publicly available; easy to use with regular courses; and accessible to non-modelers. 4
GTAP: the database GTAP establishes standards, coordinates the work and brings it altogether into ONE consistent analytical database: Global coverage: 158 regions, of which 139 individual countries (13 in v1!) 65 economic sectors (37 in v1) Bilateral trade data/shipping margins Protection data MacMap (from ITC/Geneva and CEPII) National databases (IO tables): national collaborators Increasing physical data Energy, CO2 emissions, other GHG emissions and other pollutants Land-use and water use Philosophy: Find the best person in the world to do the job and sell them on it! 5
GTAP: Data Principles The data are key for credible policy analysis Broad participation: GTAP pools data development efforts, get best person in world on any given task Documentation Public availability Regular upgrades (just released V11) improved quality; Increased regional/sectoral definition; and Additional data, e.g. better services trade, public procurement 6
History of releases Release Released Regions Sectors Base Year GTAP 1 1993 15 37 1990 GTAP 2 1994 24 37 1992 GTAP 3 1996 30 37 1992 GTAP 4 1998 45 50 1995 GTAP 5 2001 66 57 1997 GTAP 6 2005 87 57 2001 GTAP 7 2008 113 57 2004 GTAP 8 2012 129 57 2004/07 GTAP 9 2015 140 57 2004/07/11 GTAP 10 2019 141 65 2004/07/11/14 GTAP 11 2022 158 65 2004/07/11/14/17
Sectoral coverage Paddy rice Coal Wood products Electrical eqpt. Communication Wheat Oil Pulp, paper etc. Other mach. & eqpt. Financial services Energy intensive Other cereals Gas Refined oil etc. Other manu. Insurance Vegetables & fruits Other minerals Processed food Pharmaceuticals Electricity Real estate Oil seeds Red meat Other chemicals Gas distribution Other bus. services Agriculture etc. Sugar cane & beet White meat Rubber & plastics Oth. Manufacturing Water Recreation etc. Plant-based fibers Vegetable oils Other mineral prod. Construction Public Admin. Services Other crops Dairy products Ferrous metals W & R trade Education Beef etc. Processed rice Other metals Hotels, rests. etc. Health Poultry, pork, etc. Refined sugar Metal products Warehousing etc. Dwellings Raw milk Other food Mot. vehicles & parts Land transport Wool etc. Beverages & tobacco Other trp. eqpt. Sea transport Forestry Textiles Electronic eqpt. Air transport Fishing Clothing Leather products
Issues addressed using GTAP Well established: Evolution of FTAs WTO accession (used heavily for China s accession) Impact of WTO agreement: Key tool for analysis of Doha Cost of climate change mitigation, impact on trade Sector trade disputes: steel tariffs, textiles and apparel quotas Emerging areas of application: Technology spillovers Energy, emissions and climate change mitigation Biofuels, land-use Imperfect competition/love of variety models (incl. Melitz) International migration Dynamics and international capital mobility Public procurement New policy issues drive extensions to model and database 11
GTAP: The Consortium Core support from 31 institutions: International: ADB (Philippines), EC JRC/IPTS (Seville), EC DG-TRADE (Brussels), ERIA (Jakarta), IADB (USA), IFPRI (USA), IMF (USA), ITC (Switzerland), OECD (France), World Bank (USA), UNCTAD (Switzerland), UNECA (Ethiopia), WTO (Switzerland) National: CEPII (France), Department for International Trade (UK), Development Research Center (China), ESRI (Japan), ERS/USDA (USA), Global Affairs (Canada), RIETI (Japan), Th nen Institute (Germany), US Dept. of Commerce (USA), US EPA (USA), US ITC (USA) Academia and private sector: Wageningen WUR (Netherlands), GRIPS (Japan), MIT (USA), KPMG (Australia, UK, USA), McKinsey (USA) And supported by 3 at-large members Started with just 2 consortium members in 1994! Agencies represented on the Advisory Board Providing core funding and advice on future directions 12
GTAP: The Network GTAP U Intro, mid-level, advanced and specialized courses Some in-house, some online only Journal of Global Economic Analysis (JGEA) Plus technical and working papers Discussion list GTAP-L Annual conferences 2006 Addis Ababa, 2014 Dakar, 2022 Kigali (postponed till 2025) GTAP Web site (http://www.gtap.agecon.purdue.edu/) Web is key to communication and dissemination of information GTAP network is 25,000+ strong from over 100 countries Contributing data Altering the model(s), Writing papers and attending conferences Thousands of GTAP-based applications 13
*Contributing Members Network Percentage 13.2% Per Capita 0.6 Africa 31.4% 0.4 Asia 25.8% 2.6 Europe 20.9% 2.2 North America 4.4% 6.6 Oceania 4.4% 0.6 South America *Contributing members have participated in an event, contributed data, purchased the data base, etc. 14
Summary GTAP is now main tool for assessing economy-wide impacts of global trade and environmental issues Extensive database and network of researchers Excellent for asking what if questions and illustrating basic economic principles such as Comparative Advantage and Trade is a Two-way Street GTAP is relatively unique in economics, but likely quite similar to activities elsewhere in sciences Success of project traced back to Short Courses Consortium key to long term viability Provides funding But also key data inputs and leadership Modest contribution by many agencies provides long-run stability 15
The African Continental Free Trade Area (AfCFTA) 16
The African Continental Free Trade Agreement represents a major opportunity for countries to boost growth, reduce poverty, and broaden economic inclusion. Implementing AfCFTA would: Lift 30 million Africans out of extreme poverty and boost the incomes of nearly 68 million others who live on less than $5.50 a day; Boost Africa s income by $450 billion by 2035 (a gain of 7 percent) while adding $76 billion to the income of the rest of the world. Increase Africa s exports by $560 billion, mostly in manufacturing. Spur larger wage gains for women (10.5 percent) than for men (9.9 percent). Boost wages for both skilled and unskilled workers 10.3 percent for unskilled workers, and 9.8 percent for skilled workers. 17
Re-allocation of production from changing comparative advantage 20
Full report is available at: https://www.worldbank.org/en/topic/trade/publication/the- african-continental-free-trade-area#findings 21
Thank you! 22

