Glucose Metabolism Alterations with Glucagon Infusion
This study investigates the impact of glucagon infusion on glucose metabolism using metabolomics analysis. Results show alterations in plasma glucose, pyruvate, lactate levels, and reduction in plasma amino acids. Detailed changes are depicted in various figures, including volcano plots and heat maps.

Download Presentation

Please find below an Image/Link to download the presentation.
The content on the website is provided AS IS for your information and personal use only. It may not be sold, licensed, or shared on other websites without obtaining consent from the author. If you encounter any issues during the download, it is possible that the publisher has removed the file from their server.
You are allowed to download the files provided on this website for personal or commercial use, subject to the condition that they are used lawfully. All files are the property of their respective owners.
The content on the website is provided AS IS for your information and personal use only. It may not be sold, licensed, or shared on other websites without obtaining consent from the author.
E N D
Presentation Transcript
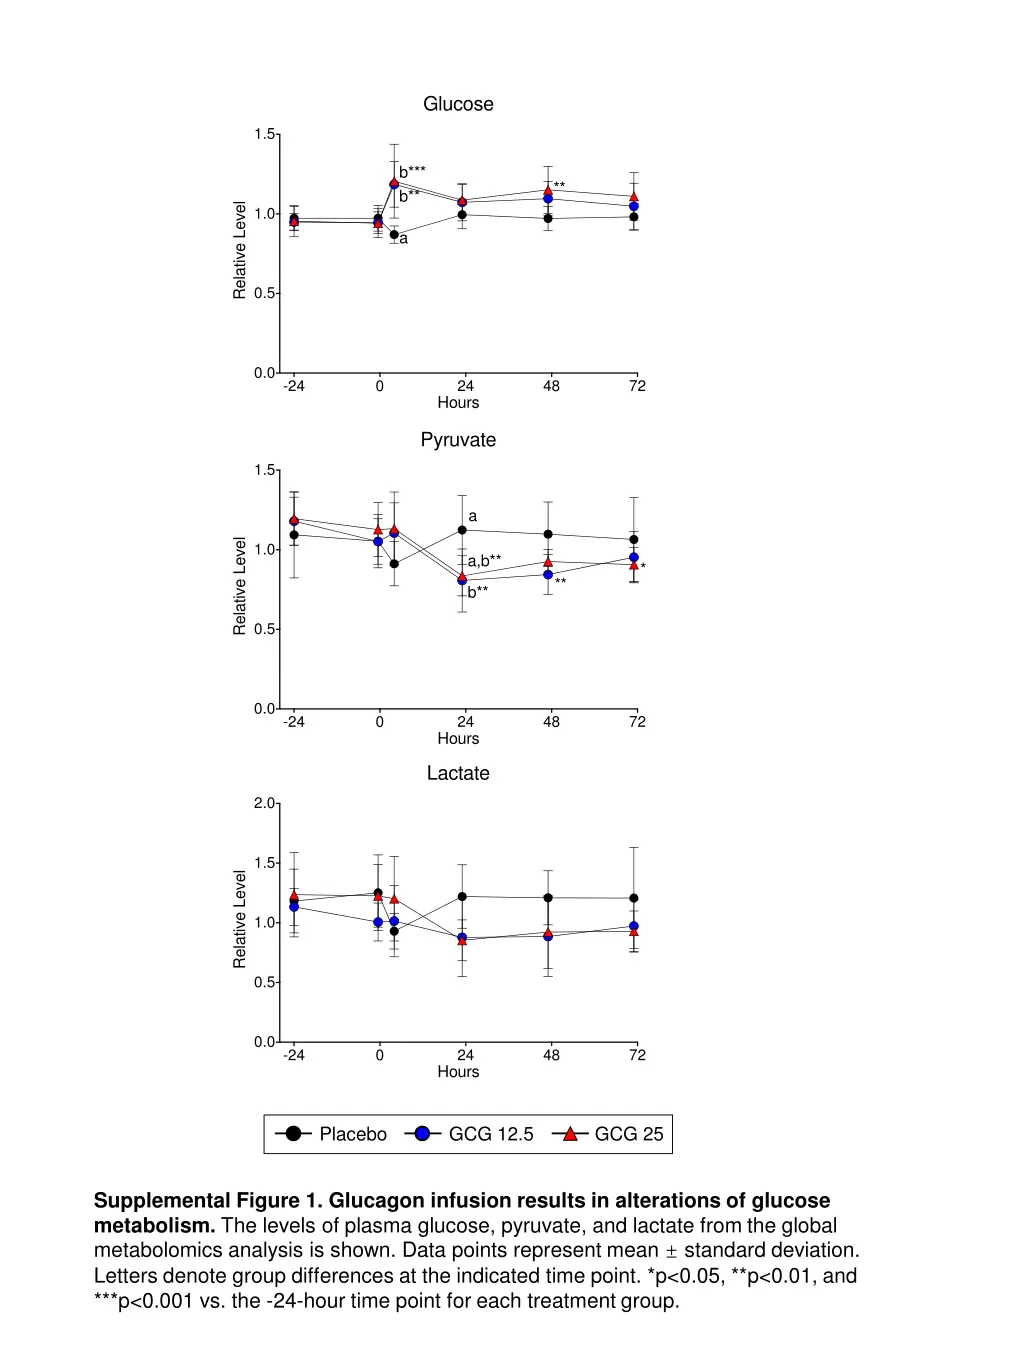
Glucose 1.5 b*** b** ** Relative Level 1.0 a 0.5 0.0 -24 0 24 48 72 Hours Pyruvate 1.5 a Relative Level 1.0 a,b** * ** b** 0.5 0.0 -24 0 24 48 72 Hours Lactate 2.0 1.5 Relative Level 1.0 0.5 0.0 -24 0 24 48 72 Hours Placebo GCG 12.5 GCG 25 Supplemental Figure 1. Glucagon infusion results in alterations of glucose metabolism. The levels of plasma glucose, pyruvate, and lactate from the global metabolomics analysis is shown. Data points represent mean standard deviation. Letters denote group differences at the indicated time point. *p<0.05, **p<0.01, and ***p<0.001 vs. the -24-hour time point for each treatment group.
GCG 12.5 vs. Placebo GCG 25 vs. Placebo 15 15 10 10 -Log10(Adj.P-value) -Log10(Adj.P-value) 5 5 0 0 -2 -1 0 1 2 -2 -1 0 1 2 Log2Fold-change Log2Fold-change Supplemental Figure 2. Volcano plots denote significant changes in plasma metabolites at 71 hours of glucagon infusion. The volcano plots represent the log2- fold change of all metabolites versus placebo for the glucagon 12.5 ng/kg/min (left) and 25 ng/kg/min (right). Metabolites with an adjusted p-value of <0.01 are denoted in red.
Placebo GCG 12.5 GCG 25 Supplemental Figure 3. Quantitative, targeted metabolomics confirms reduction in plasma amino acid levels with glucagon infusion. Plasma concentrations amino acids were measured by a quantitative and targeted metabolomics profile as described in Methods. Bars represent plasma concentration standard deviation for the indicated amino acid. Letters denote group differences at the indicated time point. *p<0.05, **p<0.01, ***p<0.001 and ****p<0.0001 vs. the -24-hour time point for each treatment group.
Placebo GCG 12.5 GCG 25 Hour: -0.5 4 23 47 71 -24 -0.5 4 23 47 71 -24 -0.5 4 23 47 71 gamma-Glutamylglutamate gamma-Glutamyl-epsilon-lysine gamma-Glutamylhistidine gamma-Glutamyl-alpha-lysine gamma-Glutamylglycine gamma-Glutamylthreonine gamma-Glutamylmethionine gamma-Glutamyltyrosine gamma-Glutamylcitrulline gamma-Glutamylglutamine gamma-Glutamylphenylalanine gamma-Glutamylisoleucine gamma-Glutamylleucine gamma-Glutamylvaline Log2 Scaled Data 2 -2 0 Supplemental Figure 4. A marked reduction in gamma-glutamyl amino acids is observed with glucagon infusion. The heat map represents change in the indicated plasma gamma-glutamyl amino acid during the study period for all three treatment groups. The data displayed are log2-transformed of the z-scaled values normalized to the placebo at the -24-hour time point. The rows were Euclidian distance clustered.