Goodness of Fit of Probabilistic Models for Electric Vehicle Charging Behavior
Examining the suitability of probabilistic models in predicting electric vehicle charging behavior is crucial for grid management and sustainability. The research explores the impact of uncoordinated charging, the need for smart systems, and the requirements for well-coordinated charging schemes using real data and driver behavioral variables.
Download Presentation

Please find below an Image/Link to download the presentation.
The content on the website is provided AS IS for your information and personal use only. It may not be sold, licensed, or shared on other websites without obtaining consent from the author.If you encounter any issues during the download, it is possible that the publisher has removed the file from their server.
You are allowed to download the files provided on this website for personal or commercial use, subject to the condition that they are used lawfully. All files are the property of their respective owners.
The content on the website is provided AS IS for your information and personal use only. It may not be sold, licensed, or shared on other websites without obtaining consent from the author.
E N D
Presentation Transcript
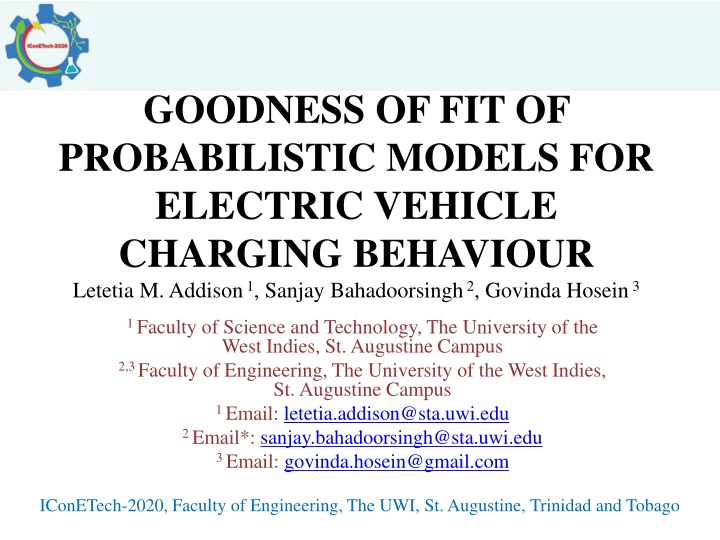
GOODNESS OF FIT OF PROBABILISTIC MODELS FOR ELECTRIC VEHICLE CHARGING BEHAVIOUR Letetia M. Addison1, Sanjay Bahadoorsingh2, Govinda Hosein 3 1 Faculty of Science and Technology, The University of the West Indies, St. Augustine Campus 2,3Faculty of Engineering, The University of the West Indies, St. Augustine Campus 1 Email: letetia.addison@sta.uwi.edu 2 Email*: sanjay.bahadoorsingh@sta.uwi.edu 3 Email: govinda.hosein@gmail.com IConETech-2020, Faculty of Engineering, The UWI, St. Augustine, Trinidad and Tobago
INTRODUCTION (1) Energy Information Administration (EIA) in 2018: 28% of US energy consumption used for transport, 92% of that supplied by petroleum Sustainable alternative to Internal Combustion Engines (ICEs): Plug-in electric vehicles (PEVs): draw electricity from battery (capacity at least 4 kWh); can be charged from external source. Main types: Battery Electric Vehicles (BEVs or EVs) Plug-in Hybrid Electric Vehicles (PHEVs) IConETech-2020, Faculty of Engineering, The UWI, St. Augustine, Trinidad and Tobago
INTRODUCTION (2) EV deployment 2013 2018 (millions) EV global stock of passenger cars surpassed 5 million in 2018, increase of 63% from 2017. Electrical power systems: impacted by integration EVs on the grid (Darabi and Ferdowsi 2011) Factors impacting electric grids (Green et al. 2010) - driving patterns, - charging characteristics (vehicle demand profiles), - charging timing (magnitude & duration of charging cycle), - vehicle penetration Charging station load: impact longevity of grids IConETech-2020, Faculty of Engineering, The UWI, St. Augustine, Trinidad and Tobago
INTRODUCTION (3) Uncoordinated charging: clustering effect of PEV charging In-home charging could still take its toll on electric system infrastructure by way of uncoordinated charging . (Muratori 2013) o Increased EV penetration: voltages imbalances & outages o Need: controlled/ coordinated charging using Smart systems Smart Grids Source: https://online.lewisu.edu/mscs/resources/what-are-intelligent-systems IConETech-2020, Faculty of Engineering, The UWI, St. Augustine, Trinidad and Tobago
INTRODUCTION (4) Properly designed, well-coordinated charging scheme: better flexibility and reliability to electrical grid (Flammini 2019) Requirements for such a coordination scheme: real data, driver behavioural variables to perform simulations Due to scarcity of EV charging data: probability distributions functions (PDFs) for driver (random) variables Fairly recent research includes: o Louie (2015): Probabilistic model; Assess impact on grids o Ul-Haq (2017): Probabilistic model; EV charging over 1 day o Almutairi et al. (2018): statistical evaluation of PDFs; stochastic model for driver variables IConETech-2020, Faculty of Engineering, The UWI, St. Augustine, Trinidad and Tobago
OBJECTIVES Exploratory and inferential analysis of probabilistic models of aggregate EV charging station and residential load profiles generate descriptive statistics based on daily load profiles construct aggregate load profiles by weekday/weekend conduct goodness of fit (GoF) evaluation among available theoretical probability density functions (PDFs) for weekday load curves deduce which PDFs provide the best fit IConETech-2020, Faculty of Engineering, The UWI, St. Augustine, Trinidad and Tobago
METHODOLOGY (1) Case study - 2009 Residential Consumption Survey (RECS): randomly selected 348 vehicles, 200 houses, 502 individuals in Midwest, U.S. Energy characteristics: household demographics (vary in size and no. of occupants), usage patterns etc. Simulations: residential power profiles & in-home PEV recharging profiles; validated with metered data: 10 min resolution, 1 year Assume: Vehicles are 60% BEVs with 200-mile (321.9 km.) and 40% PHEVs with 40-mile (64.4 km.) all-electric ranges AC charging: Level 1 (1920 W) & Level 2 (6600W) (PEV-L1 & PEV-L2 respectively) IConETech-2020, Faculty of Engineering, The UWI, St. Augustine, Trinidad and Tobago
METHODOLOGY (2) Residential demand profiles: Variable individual stochastic household behaviour Personal energy demand model: (simulation) amount of electricity to fully charge battery (depends on previous trips & charging events) No coordination scheme applied Residential Energy Eco-system (REES) model (Muratori et al. 2013) IConETech-2020, Faculty of Engineering, The UWI, St. Augustine, Trinidad and Tobago
METHODOLOGY (3) R Statistical Software: match EVs to households using PEV-L1 Aggregate household load, ??????? ????,?? : sum of base load, ???????,?? and total EV load per household, ?????,? ? ? = 1,2, .,200 at time, ? ??????? ????,?? = ???????,?? + ?????,? ? (1) Aggregate load curves by weekday (random variable) EasyFit 5.6 and XLSTAT 2019 (packages for Microsoft Excel) Maximum likelihood estimation (MLE) iterative parameter estimation; maximise log-likelihood functions Three best fitting theoretical PDFs - chosen from pre-set database (about 55 PDFs); GoF hypothesis test IConETech-2020, Faculty of Engineering, The UWI, St. Augustine, Trinidad and Tobago
METHODOLOGY (4) Goodness of Fit (GoF): overall fit of model to original data GoF hypothesis test: accept/reject observed data follow the specified distribution at significance level, ?. Kolmogorov-Smirnov (K-S) test: nonparametric test Computes largest difference between empirical (actual) and theoretical PDFs; sensitive to shape and scale parameters Reject hypothesis: if ?????? > ?????? OR if ? < 0.05 (? = 0.05) PDF with lowest ??????among others: best fit Top 3 PDFs listed among Johnson SB, Generalised Gamma, Dagum IConETech-2020, Faculty of Engineering, The UWI, St. Augustine, Trinidad and Tobago
RESULTS (1) Total Load (MW) by time of day classified by day of the week 35.00 Peak demand between 4 p.m. (16:00 hrs) and 10 p.m. (21:00 hrs) daily. 30.00 25.00 Total Load (MW) 20.00 15.00 10.00 Off-peak demand between 2 a.m. (2:00 hrs) and 5 a.m. (5:00 hrs) 5.00 0.00 17:20 20:00 0:40 10:00 10:40 11:20 12:00 12:40 13:20 14:00 14:40 15:20 16:00 16:40 18:00 18:40 19:20 20:40 21:20 22:00 22:40 23:20 0:00 1:20 2:00 2:40 3:20 4:00 4:40 5:20 6:00 6:40 7:20 8:00 8:40 9:20 Time of day (hr:mm) Friday Saturday Sunday Monday Tuesday Wednesday Thursday Figure 1: Daily Load Curves by time of day IConETech-2020, Faculty of Engineering, The UWI, St. Augustine, Trinidad and Tobago
RESULTS (2) Table 1: Descriptive Statistics for Total Load (MW) by day Week day 19.0 Week end 19.1 Mon Tues Wed Thurs Fri Sat Sun Mean 19.5 18.4 19.4 19.3 18.6 18.8 19.4 Std Dev 6.1 5.3 6.0 5.8 5.7 5.9 5.8 5.8 5.9 Min 9.6 10.0 10.2 10.2 9.8 9.9 10.2 10.0 9.9 Max 28.9 28.5 28.4 26.4 27.0 26.7 26.8 27.8 26.6 R 0.98 0.83 0.98 0.76 0.98 0.86 0.99 0.65 0.99 0.69 0.99 0.72 0.98 0.75 0.98 0.74 0.98 0.74 RMSE IConETech-2020, Faculty of Engineering, The UWI, St. Augustine, Trinidad and Tobago
RESULTS (3) Peak demand total weekly load max. 7 p.m. (under 1200 MW.) Off-peak demand: totalweekly load min. 5 a.m. (just over 400 MW). Useful for Time of Use (TOU) tariffs Total Weekly Load (MW) classified by time of day 1400 1200 Total Load (MW) 1000 800 600 400 200 0 Time of Day (hrs:mm:ss) Friday Saturday Sunday Monday Tuesday Wednesday Thursday Figure 2: Total Weekly Load Curves by time of day IConETech-2020, Faculty of Engineering, The UWI, St. Augustine, Trinidad and Tobago
RESULTS (4) Table 2: Best Fitting PDFs for Weekday Load Curves Name Johnson SB (J) Probability Density Function (PDF) ? ? ??? ? ? ? ? = ? + ??? , ? ? ? ? ??? ? ? z =x ? ?; ? < ? < ? + ?; < ?,? < ;? > 0,? > 0 ???? ? ????(?)??? ? > 0,? > 0,? > 0,? > 0, ? is the Gamma function Genera- lised Gamma (G) Dagum (D) ? ? ? ? ? = , ?? ? ? ? ?? ? ? = ? ?+?, ? ? ? ? + ? > 0,? > 0,? > 0,? > 0 IConETech-2020, Faculty of Engineering, The UWI, St. Augustine, Trinidad and Tobago
RESULTS (5) K-S 0.0162 p Pdf J 1.0 1 0.0277 0.99 G 2 0.0282 0.99 D 3 p > 0.05 in all cases. At 5% level, do not reject hypothesis that the empirical data follows the specified distributions. Figure 3: Fitted PDFs for Weekday Load Curves (J) ? = 0.441,? = 0.758 ,? = 26.639 , ? = 2.564, ? ? = 146.71,? = 0.00917 and ? = 23.824, Johnson SB PDF has the best fit. D ? = 0.0068,? = 198.62 and ? = 23.766. IConETech-2020, Faculty of Engineering, The UWI, St. Augustine, Trinidad and Tobago
CONCLUSIONS EV charging characteristics; described using probability distributions Estimated Fitted PDFs: distributions of (un-coordinated) charging times associated with household load profiles Shape and scale parameters: can be adjusted/altered (advantage) PDFs for other driver variables (arrival time, daily mileage etc.) can be generated by geographic locations, seasons etc. Future: Create coordinated schemes for EV charging behaviours Demand Side Management (DSM) - improve power consumption; development of Smart Grids IConETech-2020, Faculty of Engineering, The UWI, St. Augustine, Trinidad and Tobago
REFERENCES (1) Green, R.C., Wang, L. and M. Alam. "The impact of plug-in hybrid electric vehicles on distribution networks: a review and outlook," IEEE PES General Meeting, Providence, RI, pp. 1-8, 2010. Darabi, Z. and M. Ferdowsi. "Aggregated Impact of Plug-in Hybrid Electric Vehicles on Electricity Demand Profile, " IEEE Transactions on Sustainable Energy, vol. 2, no. 4, pp. 501-508, 2011. Muratori, M., Roberts, M.C., Sioshansi, R., Marano, V., and Rizzoni, G. "A highly resolved modeling technique to simulate residential power demand," Applied Energy, vol. 107, pp. 465 - 473, 2013. Muratori, M. "Impact of uncoordinated plug-in electric vehicle charging on residential power demand." Nature Energy, vol. 3, no. 3, pp. 193-201, 2018. IConETech-2020, Faculty of Engineering, The UWI, St. Augustine, Trinidad and Tobago
REFERENCES (2) Almutairi, A., Alotaibi, M. and M. M. A. Salama. "Goodness of Fit Statistical Analysis for Different Variables of PEV Driver Behaviour," 2018 IEEE Canadian Conference on Electrical & Computer Engineering (CCECE), Quebec City, QC, 2018, pp. 1-4, 2018. Louie, H. "Probabilistic modeling and statistical analysis of aggregated electric vehicle charging station load," Electric Power Components and Systems, vol. 43, no. 20, pp. 2311-2324, 2015 Flammini, M., Prettico, G., Julea, A., Fulli, G., Mazza, A. and Chicco, G. "Statistical characterisation of the real transaction data gathered from electric vehicle charging stations," Electric Power Systems Research, vol. 166, pp. 136-150, 2019. Ul-Haq, A., Azhar, M., Mahmoud, Y., Perwaiz, A., and Al-Ammar, E. A. "Probabilistic modeling of electric vehicle charging pattern associated with residential load for voltage unbalance assessment," Energies, vol. 10, no. 9, 1351, 2017. IConETech-2020, Faculty of Engineering, The UWI, St. Augustine, Trinidad and Tobago
THANK YOU! IConETech-2020, Faculty of Engineering, The UWI, St. Augustine, Trinidad and Tobago
