Government Funding Sources and Expenditure Analysis 2023 vs 2022
Explore the breakdown of government funding sources and expenditure for 2023 compared to 2022, detailing actual amounts, percentages, and performance. Gain insights into the Ministry of Budget and Planning's budget utilization and performance.

Download Presentation

Please find below an Image/Link to download the presentation.
The content on the website is provided AS IS for your information and personal use only. It may not be sold, licensed, or shared on other websites without obtaining consent from the author. If you encounter any issues during the download, it is possible that the publisher has removed the file from their server.
You are allowed to download the files provided on this website for personal or commercial use, subject to the condition that they are used lawfully. All files are the property of their respective owners.
The content on the website is provided AS IS for your information and personal use only. It may not be sold, licensed, or shared on other websites without obtaining consent from the author.
E N D
Presentation Transcript
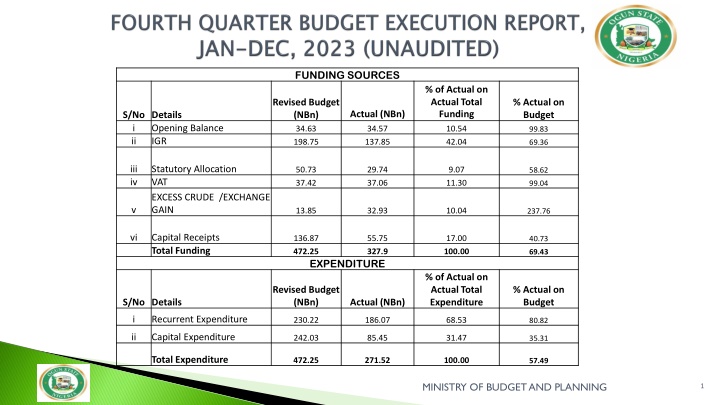
FUNDING SOURCES % of Actual on Actual Total Funding Revised Budget (NBn) 34.63 198.75 % Actual on Budget Actual (NBn) S/No Details i Opening Balance ii IGR 34.57 137.85 10.54 42.04 99.83 69.36 iii iv Statutory Allocation VAT EXCESS CRUDE /EXCHANGE GAIN 50.73 37.42 29.74 37.06 9.07 11.30 58.62 99.04 v 13.85 32.93 10.04 237.76 vi Capital Receipts Total Funding 136.87 472.25 55.75 327.9 17.00 100.00 40.73 69.43 EXPENDITURE % of Actual on Actual Total Expenditure Revised Budget (NBn) % Actual on Budget S/No Details Actual (NBn) i Recurrent Expenditure 230.22 186.07 68.53 80.82 ii Capital Expenditure 242.03 85.45 31.47 35.31 Total Expenditure 472.25 271.52 100.00 57.49 MINISTRY OF BUDGET AND PLANNING 1
Proportionate Expenditure Performance 2023 vs 2022 Expenditure Performance as at 500 450 December, 2023 stood at N N271 271. .52 52BN BN 400 which represents 57 57. .50 50% % of the total 350 budget size of of N N472 472. .25 25BN BN. . 300 The performance depicts a positive 250 change of 11 11. .20 20% % in in expenditure expenditure 200 when compared with the actual 150 expenditure for the corresponding 100 period of 2022, which was 50 0 N N244 244. .18 18BN BN representing 54 54. .14 14% % of 2023 2022 the total budget size of N N450 450. .99 99BN BN. . TOTAL BUDGET ACTUAL PERFORMANCE MINISTRY OF BUDGET AND PLANNING 2
MINISTRY MINISTRYOF BUDGET AND PLANNING OF BUDGET AND PLANNING 3
% of Actual Funding Performance on Actual Total Funding Sources Actual Funding Performance % Actual Funding Performance on Budget Approved Details Revised Budget N(Bn) Jan. Dec 2023 N(Bn) Opening Balance 34,631,640,640.90 34,568,982,908.72 99.82 10.54 IGR 198,748,909,826.51 137,853,138,204.70 69.36 42.04 STATUTORY ALLOCATION 50,730,566,593.86 29,742,305,709.43 58.63 9.07 VALUE ADDED TAX 37,422,406,721.33 37,062,477,984.77 99.04 11.30 EXCESS CRUDE/ EXCHANGE 13,845,054,076.26 32,923,465,519.40 237.80 10.04 81.15 83.00 TOTAL REVENUE 335,378,577,858.86 272,150,370,327.02 CAPITAL RECEIPT 136,872,116,588.72 55,750,890,738.30 40.73 17.00 TOTAL FUNDING SOURCES 472,250,694,447.58 327,901,261,065.32 69.43 100.00 MINISTRY OF BUDGET AND PLANNING 4
S/No S/No Details Details Actuals N(Bn) Actuals N(Bn) % of Total % of Total i Opening Balance 34.57 10.54 10.54 10.54 17 17 ii IGR 137.85 42.04 10.04 10.04 iii Statutory Allocation 29.74 9.07 42.04 42.04 iv Value Added Tax 37.06 11.30 Excess Crude/Exchange Gain v 11.3 11.3 32.93 10.04 9.07 9.07 Total Revenue Total Revenue 272.15 83.00 vi Capital Receipt OPENING BAL STATUTORY ALLOCATION EXCESS CRUDE /EXCHANGE GAIN IGR VAT CAPITAL RECEIPT 55.75 17.00 Total Funding Sources Total Funding Sources 327.90 100.00 MINISTRY OF BUDGET AND PLANNING 5
2023 2022 2023 Revised Estimates N(Bn) 2023 Revised Estimates N(Bn) 2022 Revised Estimates 2022 Revised Estimates N(Bn) Jan.- -Dec Actual Nbn) ) Jan. Actual ( (Nbn Dec % of % of Jan.- -Dec Actual (Nbn Jan. Actual ( Dec Nbn) ) % of Proportionate Performance % of Proportionate Performance Proportionate Performance Proportionate Performance S/NO. S/NO. Details Details i ii (a) Opening Balance (IGR) Ministries Boards and Corporations Total IGR Total IGR Statutory Allocation VAT Total Revenue Total Revenue Capital Receipts Excess Crude/Exchange Gain 34.63 34.57 35.08 35.00 99.83 160.67 113.32 70.53 32.18 19.17 59.58 (b) 38.08 24.53 64.42 128.00 100.07 78.18 198.75 137.85 59.07 160.17 119.24 61.07 50.73 29.74 58.62 43.10 35.27 81.84 iv v 37.42 37.06 99.04 26.59 26.90 101.15 321.53 239.22 74.40 264.95 216.41 81.68 136.87 55.75 40.73 182.73 90.28 49.41 v 13.85 32.93 237.76 3.31 5.34 161.23 TOTAL TOTAL 472.25 327.90 450.99 312.03 69.43 69.19 Actual Performance 2023 2022 150 100 50 0 IGR Statutory Allocation VAT Capital Receipts Excess Crude Oil/ Exchange Gain MINISTRY OF BUDGET AND PLANNING 6
Revised Revised Budget Budget ( (NBn NBn) ) % Performance % Performance on Total Budget on Total Budget % Total % Total Performance Performance S/No S/No Details Details Actual ( Actual (NBn NBn) ) i Opening Balance 35.084 35.00 11.22 99.75 ii IGR 160.174 119.24 38.21 74.44 iii Statutory Allocation 43.096 35.27 11.30 81.84 iv VAT 26.594 26.90 8.62 101.15 v CAPEX (F.G ROAD REFUND) 3.312 5.34 1.71 161.23 vi Capital Receipts 182.726 90.28 28.93 49.41 Total Total 450.99 312.03 100.00 69.19 7 MINISTRY OF BUDGET AND PLANNING
REVISED BUDGET N(BN) ACTUAL PERFORMANCE % PERFORMANCE ON TOTAL BUDGET S/N AGENCIES N(BN) 1 Board of Internal Revenue 90,000,000,000.00 69,908,967,740.00 77.68 2 Ministry of Finance 16,166,685,000.00 13,277,119,060.64 82.13 3 Bureau of Lands and Survey 35,299,740,000.00 21,866,590,962.04 61.95 4 OPIC 8,020,503,000.00 3,045,849,136.69 37.98 Ogun State Planning & Development Permit Authority 5 7,394,753,884.18 2,608,283,942.81 35.27 6 Ministry of Education 1,887,946,140.00 1,338,957,294.03 70.92 Ministry of Industry, Trade and Investment 7 2,100,000,000.00 767,873,200.85 36.57 8 Ogun State Housing Corporation 1,891,121,640.00 1,078,500,299.43 57.03 9 Ministry of Physical Planning 545,242,443.35 815,517,666.96 149.57 10 Agricutural Development Corporation 551,671,932.00 352,709,289.63 63.93 11 Office of the Accountant- General 349,575,988.14 601,877,171.86 172.17 12 Ministry of Forestry 353,176,127.50 284,063,402.28 80.43 13 Judiciary 161,004,364.24 165,572,804.92 102.84 14 Ministry of Agriculture 1,196,729,270.02 407,262,415.78 34.03 15 Forestry Plantation Projection (AREA J4) 174,402,795.00 104,614,300.00 59.98 Sub-Total 166,092,552,584.43 116,623,758,687.92 70.22 Others TOTAL 32,656,357,242.08 198,748,909,826.51 21,229,379,516.78 137,853,138,204.70 65.01 69.36 MINISTRY OF BUDGET AND PLANNING 8
MINISTRY MINISTRYOF BUDGET AND PLANNING OF BUDGET AND PLANNING 8
Actual Expenditure Jan. Dec 2023 N(Bn) % Performance on Total Budget % of Total Actual Expenditure Details Revised Budget N(Bn) Salaries & Allowances 84,984,275,889.03 72,735,903,022.17 85.59 26.79 Consolidated Revenue Fund Charges 21,585,065,202.70 15,479,780,351.62 71.72 5.70 Total Personnel Cost 106,569,341,091.73 88,215,683,373.79 82.78 32.49 Overhead Cost 75,743,151,086.23 50,749,807,350.26 67.00 18.69 Public Debt Charges (Overhead ) 47,902,773,546.29 47,107,651,291.32 98.34 17.35 Total Recurrent Expenditure 230,215,265,724.25 186,073,142,015.37 80.83 68.53 Capital Expenditure 242,035,428,723.32 85,452,913,506.62 35.31 31.47 Public Debt Charges (Capital) 0.00 0.00 0.00 0.00 Total Capital Expenditure 242,035,428,723.32 85,452,913,506.62 35.31 31.47 Total Expenditure 472,250,694,447.57 271,526,055,521.99 57.50 100.00 MINISTRY OF BUDGET AND PLANNING 10
Actual Expenditure Jan. Dec 2022 N(Bn) % of Total Actual Expenditure Revised Budget N(Bn) % Performance on Budget Details Salaries & Allowances 75,975,733,186.80 63,467,733,355.04 83.54 25.99 Consolidated Revenue Fund Charges 20,752,090,767.67 14,391,535,368.70 69.35 5.89 Total Personnel Cost 77,859,268,723.74 80.49 31.89 96,727,823,954.47 Overhead Cost 57,746,818,551.74 35,738,455,318.52 61.89 14.64 Public Debt Charges (Overhead ) 28,013,395,249.03 27,904,815,324.97 99.61 11.43 Total Recurrent Expenditure 141,502,539,367.23 77.54 57.95 182,488,037,755.24 Capital Expenditure 268,498,528,922.80 102,677,582,042.48 38.24 42.05 Public Debt Charges (Capital) 0.00 0.00 #DIV/0! 0.00 Total Capital Expenditure 102,677,582,042.48 38.24 42.05 268,498,528,922.80 TOTAL EXPENDITURE 244,180,121,409.71 54.14 100.00 450,986,566,678.04 MINISTRY OF BUDGET AND PLANNING 11
2023 2022 Actual Performance N(Bn) Actual Performance N(Bn) S/N Details % of Total % of Total % Change i ii iii iv Salaries and Allowances CRFC Total Personnel Cost Overhead Cost Public Debt Charges 26.79 63.47 25.99 14.59 72.73 5.70 14.39 5.89 7.57 15.48 Total Personnel Cost 88.21 32.49 77.86 31.89 13.29 18.69 35.74 14.64 42.00 50.75 17.35 27.90 11.43 68.85 47.11 Total Recurrent Expenditure Capital Expenditure Total Expenditure Total Recurrent Expenditure 68.53 57.95 31.50 186.07 141.50 v 31.47 102.68 42.05 -16.78 85.45 Total Expenditure 100.00 100.00 11.20 271.52 244.18 Actual Expenditure Performance 200 100 0 Salaries & Allowances CRFC Overhead Cost PDC Capital 2023 2022 MINISTRY OF BUDGET AND PLANNING 12


 ACTUAL PERFORMANCE")