Government Spending and Hospital Health Promotion Activities for Better Health Outcomes
Explore how local government spending and hospital health promotion activities are linked to improved health outcomes. Findings suggest a potential for better population health outcomes through collaborative efforts between governmental and non-governmental sectors. Public spending data from local governments and hospital provision of community health services were analyzed to assess the impact on health indicators like premature death rates, preventable hospitalizations, and more.

Download Presentation

Please find below an Image/Link to download the presentation.
The content on the website is provided AS IS for your information and personal use only. It may not be sold, licensed, or shared on other websites without obtaining consent from the author. If you encounter any issues during the download, it is possible that the publisher has removed the file from their server.
You are allowed to download the files provided on this website for personal or commercial use, subject to the condition that they are used lawfully. All files are the property of their respective owners.
The content on the website is provided AS IS for your information and personal use only. It may not be sold, licensed, or shared on other websites without obtaining consent from the author.
E N D
Presentation Transcript
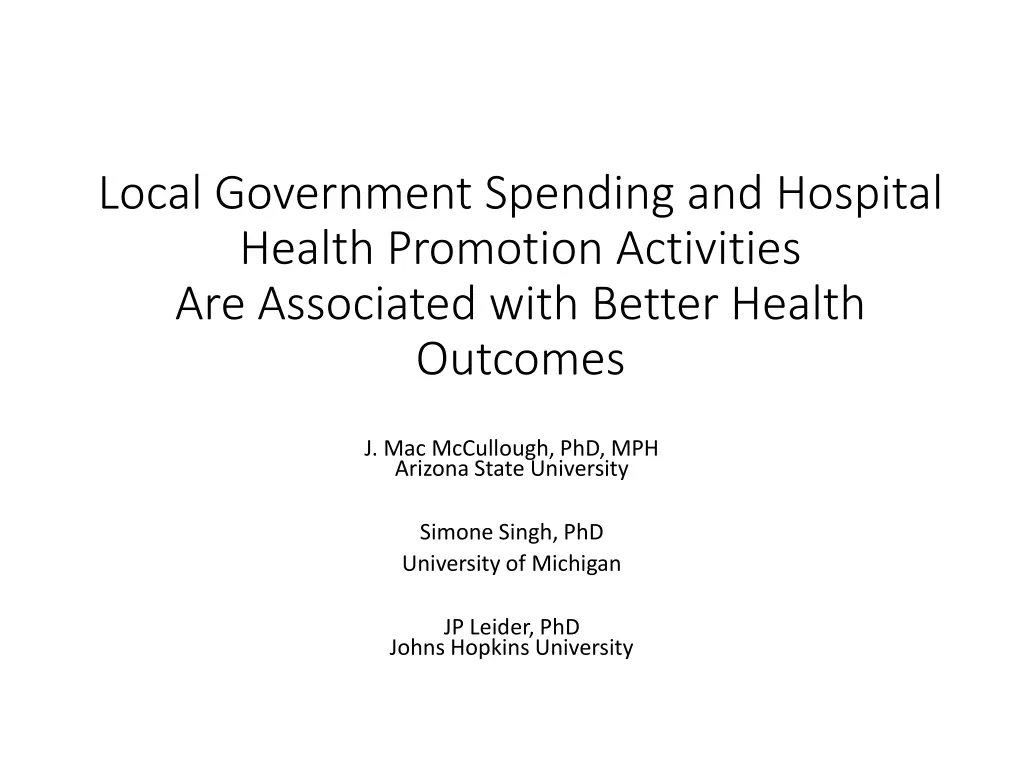
Local Government Spending and Hospital Health Promotion Activities Are Associated with Better Health Outcomes J. Mac McCullough, PhD, MPH Arizona State University Simone Singh, PhD University of Michigan JP Leider, PhD Johns Hopkins University
Background The U.S. spends far more on health care than other developed nations Yet we rank poorly in terms of our health outcomes Some theorize that we overinvest in health care and underinvest in other areas.
Background Recent findings suggest a link between public health and social services expenditures and population health outcomes Relationship observed at national, state, and local levels. Data limited to contributions of governmental expenditures Increasing recognition of the importance of multi-sector (i.e., non- governmental) contributions to health outcomes Participation by non-governmental partners in public health activities can increase availability of public health services and decrease preventable death rates.
Background & Purpose While many non-governmental actors are important for population health outcomes, hospitals stand out in particular as they regularly provide a number of health promotion services to patients and the broader community. It is unknown whether public expenditures are relatively more or less impactful depending on the availability of hospital health promotion services. The purpose of this analysis was to examine whether the effect of local public spending on health and social services on health outcomes varies according to the availability of hospital health promotion services in the local community.
Methods: Data Sources Public spending across a county 2007 2012 data for all 80,000+ local governments Tracks spending for dozens of categories. This analysis focused on 15 key social services areas, collapsed into health, social services, and education (per McCullough & Leider 2016) Can account for county-level SES/area health resources Improved health outcomes? 2012 2017 data for 2,300+ counties Premature death (YPLL), % in fair/poor health, preventable hospitalization rate physical inactivity rate, injury death rate, low birthweight rate, Hospital provision of community health services across a county 2007 2012 data from AHA Annual Survey Tracks service provision (Y/N) for 17 key community health services & aggregate to county level (per Rauscher & Vyzas 2012) Also account for county-level hospital and market characteristics
Categories of Social Services Spending Examined Parks & Recreation Protective Inspections Public Welfare Sewerage Transportation Waste Management 3. EDUCATION K-12 Education Higher Education 1. HEALTH Community Health Care & Public Health Public Hospitals Welfare payment to medical vendors 2. SOCIAL SERVICES Community Development & Housing Fire Protection Libraries Natural Resources
Types of Hospital Community Health Services Examined 1. 2. 3. 4. 5. 6. 7. 8. 9. 10. Occupational health program 11. Patient education program Child wellness program Community outreach program Crisis prevention program Emergency department Fitness center Health fair Health information center Health screening program Nutrition program 12. Patient representative services 13. Social work program 14. Support groups 15. Teen outreach program 16. Transportation services 17. Volunteer services
Methods: Analytic Models Lagged longitudinal regression: Health Outcomes (year 4) = Spending (year 1) Hospital Services (year 1) Data from 2007-2017 Addressing endogeneity: Calculate county-specific mean spending for each expenditure category and include in model Calculate year-specific deviation from the county mean for each expenditure category and include in model Thus, regress outcomes on each additional dollar spent, not total spending or total county wealth Addressing spatial autocorrelation: Calculate the population-average value for the outcome of interest in all neighboring counties and include in model Addressing non-linearity: Use both (spending deviation) and (spending deviation)2 Address clustering: Account for state-level clustering using state-level random effects Account for within-county correlation using robust standard errors
Counties with and without hospitals are markedly different County Characteristic Overall Counties With Hospitals $464 $838 $1,991 -- -- -- -- -- 8,077 17.1 71.4 27.1 78.2 8.2 Counties Without Hospitals County Mean Spending For: Health Social Services Education County-level Hospital Characteristics Mean number of community health services provided (0-17) Any for-profit beds in county Health system affiliation within county: None (no health-system-affiliated hospitals) Some (some affiliated and some non-affiliated hospitals) All (all hospitals are health-system-affiliated) County Health Measure Years of potential life lost per 100,000 population % of population in fair/poor health Preventable hospital stays per 1,000 Medicare enrollees Deaths due to injury per 100,000 population % of adults that are physically inactive % of births that are low birthweight $556 $859 $1,997 $155* $756* $1,989 9.7 -- -- 14.3% 41.6% 20.0% 38.4% -- -- -- 7,996 16.9 71.3 26.8 77.0 8.1 8,538* 17.8* 72.1 28.4* 83.1* 8.6*
Health and social services spending differs in communities with high vs. low hospital provision of community health services 25% 20% Mean County Spending Versus National Average 15% 10% 5% 0% Health Spending Social Services Spending Education Spending -5% -10% -15% -20% -25% County-level Hospital Community Health Service Provision: Quartile 2 (8-10 services) Quartile 1 (< 8 services) Quartile 3 11-12 services) Quartile 4 (> 12 services)
Increases in governmental spending was associated with improved health outcomes mainly in counties with hospitals County Health Measure Rate of Preventable Hospital Stays Years of Potential Life Lost Any Hospitals in County -0.109 % in Fair/ Poor Health Rate of Physical Inactivity Rate of Deaths Due to Injury Rate of Low Birthweight County Characteristic (Using 5-year Lag) No Hospitals in County -0.340 Any No Any No Any No Any No Any No 0.000 0.004 0.002 -0.003 0.010 -0.003* -0.009* -0.004 -0.009 -0.030 % Deviation from County 07- 12 Mean HEALTH Spending % Deviation from County 07- 12 Mean SOCIAL Spending % Deviation from County 07- 12 Mean EDUCATION Spending County 07-12 Mean HEALTH Spending County 07-12 Mean SOCIAL Spending County 07-12 Mean EDUCATION Spending N -1.455** 2.005 -0.002 -0.001 -0.015* 0.011 -0.006** -0.004 0.004 0.028 0.033 0.006 -2.370** -3.537 - 0.015*** -0.009 0.000 -0.004 0.009*** 0.001*** -0.015 -0.012 -0.139** -0.099 -0.164*** 0.052 -0.000 -0.000 -0.000 0.009*** - - 0.001*** -0.001 -0.000 -0.003 0.011* -0.035 0.001*** -0.00 -0.817*** -0.312 - 0.001*** 0.000*** -0.000 -0.000 - 0.006*** 0.002** -0.002 -0.002* -0.001 - 0.146*** 0.046* 0.197*** -0.162 0.003* 0.004*** -0.003* 0.002** 0.005*** 0.024*** 0.009 13979 3464 6965 1871 14107 3447 9546 2666 7433 1787 13976 3459
More hospital community health services and increases in governmental spending are both associated with gains in county health outcomes and County Health Measure Rate of Preventable Hospital Stays Inactivity -0.002 0.001 County Characteristic (Using 5-year Lag) Years of Potential Life Lost -0.097 % in Fair/ Poor Health -0.000 Rate of Physical Rate of Deaths Due to Injury -0.011* Rate of Low Birthweight -0.014 % Deviation from County 07-12 Mean HEALTH Spending % Deviation from County 07-12 Mean SOCIAL Spending % Deviation from County 07-12 Mean EDUCATION Spending County 07-12 Mean HEALTH Spending -1.572** -0.003 -0.015* -0.006*** -0.002 -0.041 -2.361** -0.014*** -0.003 0.010* -0.005 -0.174** -0.165*** -0.000 0.000 -0.000 -0.000 -0.010* County 07-12 Mean SOCIAL Spending -0.831*** -0.001*** -0.006*** -0.004*** -0.002* -0.148*** County 07-12 Mean EDUCATION Spending 0.206*** 0.000** 0.002** 0.000 0.002*** 0.024*** # Hospital Community Health Services (0-17) -9.714* -0.032* -0.332* -0.011 -0.207** -0.267 Hospitals in County Part of Health System) None Some (Ref.) -28.579 (Ref.) -0.060 (Ref.) -0.420 (Ref.) -0.128 (Ref.) -0.234 (Ref.) -0.093 All 38.398 0.043 -0.660 -0.188 -0.381 -1.113 Any For-Profit Hospital Beds in County 116.084*** 0.163 -0.082 0.337** 1.042 8.746** N 12770 6292 12880 8632 6412 12773
Discussion Both hospital-provided community health services and local governmental spending impact health outcomes, Public health systems may benefit from purposive, collaborative work with hospitals. Likewise, hospitals aiming to promote population health may benefit from collaborative work with governmental health, social services, and education programs. Local governmental policymakers may consider prioritizing ways to promote service provision by the private sector to leverage the local investments already made toward health and social services.
Thank you! Questions?