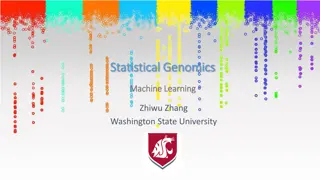
GPU and Machine Learning Solutions for Comparative Genomics
Dive into the world of GPU and machine learning solutions for comparative genomics with a focus on mapping DNA sequences to genomes, disease risk prediction, chronic lymphocytic leukemia prognosis, and utilizing whole exome data for variant detection and analysis. Explore the challenges and opportunities in leveraging advanced technologies for genomics research and precision medicine.

Download Presentation

Please find below an Image/Link to download the presentation.
The content on the website is provided AS IS for your information and personal use only. It may not be sold, licensed, or shared on other websites without obtaining consent from the author.If you encounter any issues during the download, it is possible that the publisher has removed the file from their server.
You are allowed to download the files provided on this website for personal or commercial use, subject to the condition that they are used lawfully. All files are the property of their respective owners.
The content on the website is provided AS IS for your information and personal use only. It may not be sold, licensed, or shared on other websites without obtaining consent from the author.
E N D
Presentation Transcript
GPU and machine learning solutions for comparative genomics Usman Roshan Department of Computer Science New Jersey Institute of Technology
Outline Talk centered around problem of mapping DNA sequences to genome, analysis, and applications Prediction of chronic lymphocytic leukemia with whole exome sequences and machine learning Data processing Results Graphics Processing Unit program for mapping divergent reads to genomes and applications on real data Overview of program Results on simulated and real data
Disease risk prediction Prediction of disease risk with genome wide association studies has yielded low accuracy for most diseases. Family history competitive in most cases except for cancer (Do et. al., PLoS Genetics, 2012)
Disease risk prediction Our own studies have shown limited accuracy with various machine learning methods Univariate and multivariate feature selection Multiple kernel learning What accuracy can we achieve with machine learning methods applied to variants detected from whole exome data?
Chronic lymphocytic leukemia prediction with exome sequences and machine learning We selected exome sequences of chronic lymphocytic leukemia from dbGaP. Largest at the time of download in August 2013. 186 cases and 169 controls Case and control prediction accuracy with genetic variants unknown Same dataset previously studied in Wang et. al., NEJM, 2011 where new associated genes are reported but no risk prediction
What is whole exome data? Human genome sequence Introns Coding regions Exons Illumina 76bp short reads (exome data). In practice flanking regions are also sequenced and so some intronic regions are included.
Obtain structural variants (1) Human genome reference sequence Short reads are aligned to human genome Data of size 3.2 Terrabytes and 140X coverage Mapped to human genome reference with BWA MEM (popular short read mapper)
Obtain structural variants (2) ACCAG ATTGA ACCAG ACCAG ACCAG ACCCG ACCCG ACCCG ATT--A ATT--A ATT--A ATTGA ATTGA ATTGA Short reads from a Single individual Human genome reference Heterozygous indel Heterozygous SNP A/C Obtained SNPs and indels from the alignments for each individual
Obtain structural variants (3) A/C C/G A/C C/G C0 AA CC C0 0 0 C1 AC CG C1 1 1 C2 AA GG C2 0 2 Co1 AC CG Co1 1 1 Co2 CC CG Co2 2 1 Numerically encoded Combine variants from different individuals to form a data matrix Each row is a case or control and each column is a variant 180 cases and 155 controls after excluding very large files and problematic datasets 545,721 SNPs and indels (530,129 SNPs, 15,592 indels)
Perform cross-validation study 0 0 1 2 0 . . . 0 2 2 2 1 . . . .. . 1. Split rows randomly into training validation sets (90:10 ratio). 2. Rank all variants on training 3. Learn support vector machine classifer on training data with top k ranked variants 4. Predict case and control on validation data. 5. Compute error and repeat 100 times Training data Validation data Full dataset: each row is a case or control individual and each column is a variant (SNP or indel)
Variant ranking F0 F1 F2 F1 F2 F0 C0 1 2 0 C0 2 0 1 C1 1 2 1 C1 2 1 1 C2 1 2 2 C2 2 2 1 Co1 1 0 1 Co1 0 1 1 Co2 2 0 0 Co2 0 0 2 Rank features
Different feature rankings Correlation coefficients between rankings on SNPs F-score Chi-square Pearson 0.99 0.37 F-score 0.37
Risk prediction with chi-square ranked SNPs Accuracy of Top Ranked Features ? Mean accuracy of 85.7% with top 60 ranked SNPs (across 100 splits) 1? 0.9? 0.8? Accuracy ? 0.7? snps? snps_indel? 0.6? indel? 0.5? 0.4? 0.3? top10? top20? top30? top40? top50? top60? top70? top80? top90? top100? top200? top300? top400? top500? top600? top700? top800? top900?top1000? Top ranked snps? Mean accuracy with significant SNPs only is 81% and significantly lower (Wilcoxon rank test p- value=10-14) Significant SNPs on chromosome 14 in IGH gene, predictive SNPs on chromosomes 2, 14, and 15 in intron and exons of IGK, IGH, and LOC642131. One predictive SNP has mutations only in case individuals. Previous genes not significant.
Principal component analysis of SNP data PCA plot snps top 60 Features chi square PCA plot snps all Features 0.10 0.10 0.00 PC2 PC2 0.00 0.10 0.10 0.00 0.05 0.10 0.05 0.00 0.05 0.10 0.15 0.20 0.05 PC1 PC1 PCA plot of top 60 chi-square ranked SNPs PCA plot of all 530,129 SNPs
Summary Our predictive could be used for prognosis but replication in a different sample is first required. Better alignments may yield more predictive variants. NextGenMap has a better mapping rate than BWA but is much slower Would our pipeline work other cancers?
Mapping divergent short reads to genomes Human genome reference sequence Short reads are aligned to human genome Recall the problem of mapping short read to genomes Methods based on hash-tables and Burrows-Wheeler transform are fast but accuracy falls quickly at divergence increases High performance Smith-Waterman implementations like CUDASW++ and SSW take long to finish (even for bacterial genome mapping) Our objective: Align divergent reads faster than Smith-Waterman and more accurate than hash-tables and Burrows-Wheeler transform.
MaxSSmap algorithm Input: Whole genome and a short read Genome fragments of same length Thread 4 Thread 5 Thread 0 Thread 1 Thread 2 Thread 3 Thread number i maps the read to fragment i. Threads run in parallel on a GPU (or CPU with many cores) We also account for junctions between fragments
Experimental study Genome sequence Align reads with NextGenMap Some reads are not mapped due to mismatches and gaps. We realign them with MaxSSmap and Smith- Waterman
Simulation study Div. BWA (multi- core) NextGenMap (GPU) NextGenMap+M axSSmap_fast NextGenMAp+ MaxSSmap NextGenMap+CU DASW++ 30% with gaps 0.5 (0) 19 (0.4) 82 (2.9) 90.5 (3.5) 92.5 (1.6) Time mins 0.4 2.1 162 222 1528 Simulated 1 million 251 bp E.coli reads with Stampy and aligned to Ecoli genome (approximately 4.6 million base pairs). We know the true positions of the reads. Shown above are percentage of reads that were correctly mapped by each program (incorrect in parenthesis)
Ancient DNA mapping Aligned 100,000 76bp ancient horse DNA reads to the horse genome (approximately 2.3 billion base pairs). Measure number of reads that were mapped. Shown above are percentage of reads that were mapped by each program MaxSSmap alignments contain 39% mismatches on the average
Mapping paired reads Genome sequence Reads come in pairs. We align them with NextGenMap and expect them to be mapped within 500 base pairs We realign pairs 1. where both are mapped farther than 500 base pairs 2. where at least one read in the pair is unmapped
Realigning paired reads to human genome Align 100,000 101 bp paired reads from NA18278 in 1000 genomes to human genome reference (3 billion base pairs). Shown here are percent of paired reads whose mapped positions are within 500 base pairs (also known as concordant reads). In MaxSSmap we realign discordant reads from NextGenMap as well. MaxSSmap alignments have 19% mismatches on the average Variant detection not performed yet
Summary Better accuracy and mapping rate than NextGenMap and BWA Runtime for large genomes still very high relative to NextGenMap but faster than Smith- Waterman (speedup increases with number of reads). More analysis needed on real data
Software and acknowledgements Our software, data, and publications can be found at http://www.cs.njit.edu/usman Students: Bharati Jhadev, Nihir Patel, and Turki Turki Dennis R. Livesay for GPU cluster at University of North Caroline at Charlotte and Shahriar Afkhami for GPU machine at NJIT NJIT system admins David Perel, Kevin Walsh, and Gedaliah Wolosh for high performance computing support and storage of genomic data.
References Turki Turki and Usman Roshan, MaxSSmap: A GPU program for mapping divergent short reads to genomes with the maximum scoring subsequence (submitted) Bharati Jhadav, Nihir Patel, and Usman Roshan, Prediction of chronic lymphocytic leukemia with exome sequences, machine learning (in preparation for submission)
Thank you! Questions .


")
")
")