Learn how to graph linear functions with detailed examples and step-by-step instructions. Understand slope-intercept form, finding solutions, and more to master graphing linear equations effectively.
Please find below an Image/Link to download the presentation.
The content on the website is provided AS IS for your information and personal use only. It may not be sold, licensed, or shared on other websites without obtaining consent from the author. If you encounter any issues during the download, it is possible that the publisher has removed the file from their server.
You are allowed to download the files provided on this website for personal or commercial use, subject to the condition that they are used lawfully. All files are the property of their respective owners.
The content on the website is provided AS IS for your information and personal use only. It may not be sold, licensed, or shared on other websites without obtaining consent from the author.
E N D
Presentation Transcript
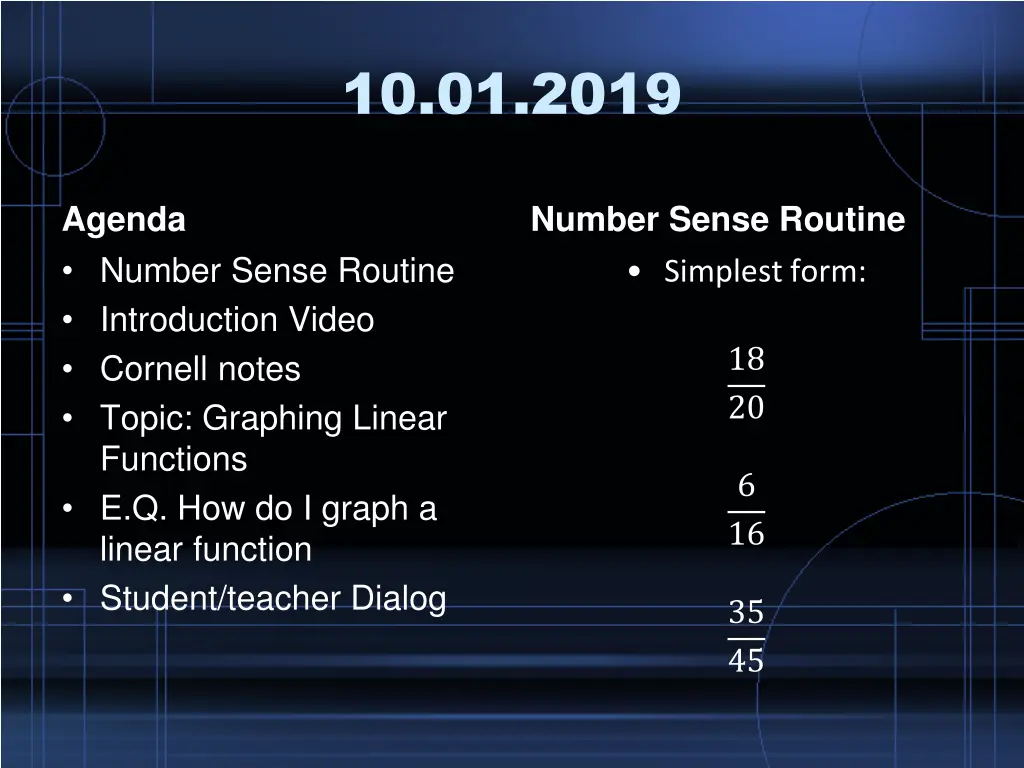
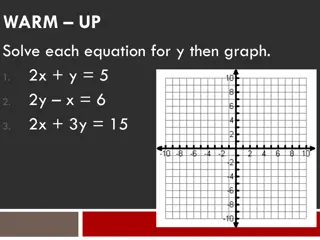
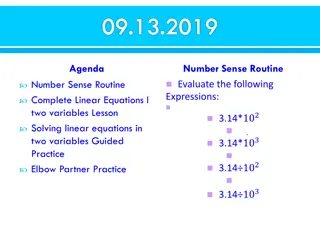
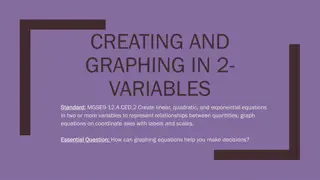
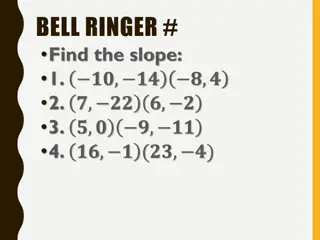
10.01.2019 Agenda Number Sense Routine Introduction Video Cornell notes Topic: Graphing Linear Functions E.Q. How do I graph a linear function Student/teacher Dialog Number Sense Routine Simplest form: 18 20 6 16 35 45
Slope-Intercept The m in the slope-intercept form is ALWAYS attached to the X variable. The slope is NEVER including the X variable For example, if given y = 3x + 4 the slope is 3 NOT 3x.
Y-intercept The y-intercept has an x-coordinate of ZERO
Y-intercept To find the y- intercept, plug in ZERO for x and solve
Y-Intercept Summary The y-intercept is the b in the slope intercept form. This b (y-intercept) is your starting point on the graph. To easily remember this, think of b as you Beginning point. For example, in y = 3x + 4 the Beginning point is at (0,4) {Remember: to find the y- intercept, plug on zero for the x.}
10.02.2019 Agenda Number Sense Routine Introduction Video Cornell notes Topic: Graphing Linear Functions E.Q. How do I graph a linear function Student/teacher Dialog Number Sense Routine Simplest form: Simplest form: 16 62 16 62 15 20 32 24 15 20 32 24
Step 4: Denominator is the horizontal change (RUN)
Step 5: Graph at least 3 points and connect the dots
10.03.2019 Agenda Number Sense Routine Graphing linear Inequalities Video Graphing Equations Review Group Activity Student/teacher Dialog Number Sense Routine Make X the Subject Make X the Subject Simplest form: 7 ? ? 3 63 16 62 7 ? ? 3 63 5 ? ? 4 15 20 100 4 ? ? 2 40 32 24 5 ? ? 4 100 4 ? ? 2 40
Group Activity Write the linear equation on the top of the graphing paper Graph the linear equation Make a table with three points of the line Make sure all names from the group is on your graphing paper Decorate your Graph