Gravity Measurements and Structural Analysis in Dixie Valley, Nevada
"Learn about gravity measurements and structural analysis conducted in Dixie Valley, Nevada, to understand the Basin and Range structure, rate of spreading, and historical earthquake ruptures. Explore findings on extension amounts, fault movements, and geologic observations in the region."

Download Presentation

Please find below an Image/Link to download the presentation.
The content on the website is provided AS IS for your information and personal use only. It may not be sold, licensed, or shared on other websites without obtaining consent from the author. If you encounter any issues during the download, it is possible that the publisher has removed the file from their server.
You are allowed to download the files provided on this website for personal or commercial use, subject to the condition that they are used lawfully. All files are the property of their respective owners.
The content on the website is provided AS IS for your information and personal use only. It may not be sold, licensed, or shared on other websites without obtaining consent from the author.
E N D
Presentation Transcript
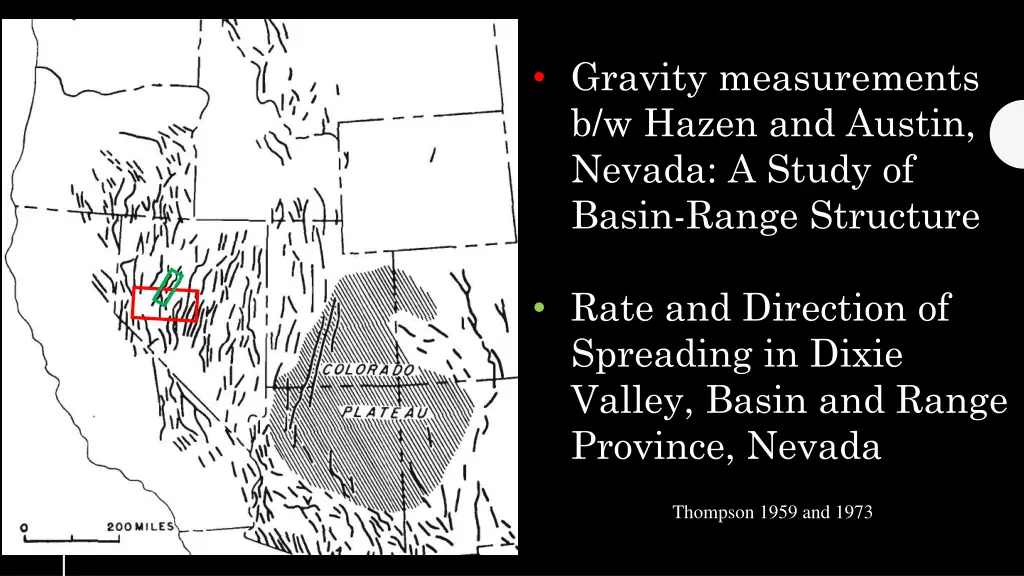
Photo courtesy of UNAVCO Gravity measurements b/w Hazen and Austin, Nevada: A Study of Basin-Range Structure Rate and Direction of Spreading in Dixie Valley, Basin and Range Province, Nevada Thompson 1959 and 1973
Motivation The motivation for both papers stems from historic earthquake ruptures in the central Basin and Range The gravity paper aims to understand the structural history of the Basin and Range using the fault movements of 1954 as a dynamic demonstration of such structures The Dixie Valley paper aims to measure extension amounts from single earthquakes (1903, 1915, 1954), measure extension in the last 12,000 years from offset Lahontan shoreline deposits, and measure extension for late Cenozoic time from geophysical studies Ultimately these papers aim to outline a basic understanding of how much extension has taken place across the Basin and Range since the late Cenozoic, and in what direction
Bouguer anomaly decreases to the west Large negative anomalies are associated with all of the basins indicating very thick fill Fairview and Dixie Valleys contain more than 5000ft of fill, Edwards Valley more than 6000ft These data indicate that the Basin and Range is basically isostatically balanced, and therefore assumptions can be made about the entirety of the Basin and Range deforming in the same manner
Structural relief, backed up by gravity data, at Dixie Valley and Fairview Valley is ~ 2 miles If the faults dip 60 (which is well within possibility based on simple geometry of Vertical disp. Vs. horizontal, seismic first motion observations, and direct measurement on bedrock surfaces) then the total extension amounts to about 2 miles Horizontal movements of the latest episode of deformation (1954), are well constrained from seismic and geodetic measurements to about 5 ft of extension normal to the fault trace Do some math, and from this you can say that this valley has extended ~1.5 mi in the last 15Ma
Geologic observations from Dixie Valley The shorelines outlined in this figure are recognized as being the highstand shorelines of Lake Lahontan, and they have been dated with reasonable certainty to about 12,000 years old They are offset vertically by faults by about 9m (~30ft) Scarps in alluvium on the other side of the basin exhibit the same amounts of offset From this, 9m of vertical offset and 10m of horizontal extension in the last 12,000 years can be assumed This gives an average extension rate of ~1mm/yr in that length of time
Geophysical observations from DV Bedrock geometry of the valley was constrained using seismic refraction, gravity, and magnetic depth estimates, as well as dip of faults in subsurface Restoring the cross section drawn from these data (above) yields 5km vertical displacement, and 6km horizontal displacement Using 15Ma as the inception of faulting (from how Miocene sediments were deposited) the spreading rate is at least 0.4 mm/yr in the last 15 m.y.
Spreading direction from slickensides Geodetic work covering S part of 1954 faults showed a NW-SE extension direction However, looking at older fault surfaces exposed in bedrock can give a measure of this relative motion over longer time periods Slickensides on fault surfaces indicate the lateral component of slip, e.g. faults striking N-S show a component of right lateral slip, faults striking NE-SW show a component of left lateral slip
Analysis of slickensides yields this plot The point Av is used to represent the spreading direction for the whole basin The mean groove direction lies between 125 and 130 to the right of Av From this average direction, they interpret the extension direction to be ~125 , or N 55 W - S 55 E This agrees with the recent geodetic derived extension direction
Main points Initial estimates of 30mi (~50km) of extension across Basin and Range from earlier gravity study is an underestimate, further geologic observations indicate ~100km (10% increase in crustal area) in the last 15 m.y. Spreading rate for the last 15 m.y. is ~0.4mm/yr, and data from shorelines indicates that rate is ~1mm/yr during the last 12,000years Extension direction seems to be consistent over a wide region of the B&R and is ~ N55W S55E