Green Mountain Transit (GMT) FY22 Operating Budget Overview
Green Mountain Transit (GMT) is an independent Municipal Corporation with a budget approved by the GMT Board of Commissioners. The FY22 budget includes assumptions, funding sources, revenue breakdowns, and key financial details for both urban and rural service areas
Download Presentation

Please find below an Image/Link to download the presentation.
The content on the website is provided AS IS for your information and personal use only. It may not be sold, licensed, or shared on other websites without obtaining consent from the author.If you encounter any issues during the download, it is possible that the publisher has removed the file from their server.
You are allowed to download the files provided on this website for personal or commercial use, subject to the condition that they are used lawfully. All files are the property of their respective owners.
The content on the website is provided AS IS for your information and personal use only. It may not be sold, licensed, or shared on other websites without obtaining consent from the author.
E N D
Presentation Transcript
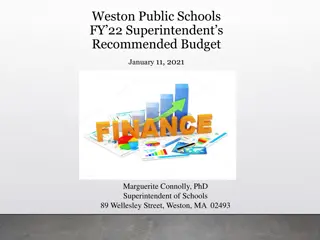
GREEN MOUNTAIN TRANSIT (GMT) FY22 OPERATING BUDGET January 13, 2021 1
GMT is an independent Municipal Corporation chartered by State statute Budget is approved by the GMT Board of Commissioners (13 members) Fiscal Year July 1 to June 30 Combined Urban & Rural Budget Urban Chittenden County Service Area plus Link routes Rural Washington, Franklin and Grand Isle County Service Area BUDGET OVERVIEW 2
BUDGET OVERVIEW (CONTINUED) FY22 Budget Assumptions State and Federal Funding level funded from FY20 amounts 4% increase in urban fixed route assessments; ADA assessments reduced by 0.9%; total urban assessment increases of 1.3% Utilization of roughly $1.84M (Urban: $1.53M/Rural: $309.9K) of legacy grant balances and reserve funding to balance revenue shortfalls Fare projections reduced, however not eliminated Medicaid revenue budgeted increase of 4.7% 1.5% increase budgeted in employee salaries and wages 6% increase budgeted for health insurance rates and commercial insurance Significant decrease in fuel budget and legal expense line items Optimal capital investment maintained 3
Federal, State, and Local Revenues Municipal Member Assessments Municipal Paratransit Assessments Local Operating Assistance Federal Urban Formula Grant (5307) Federal Rural Operating Grant (5311) State Regular Subsidy Operating Grant E&D Grants and Cash Match CMAQ Grants Preventative Maintenance Grants Other Federal/State Grants Fund Balance Reserves Capital Reserve Revenue Total Federal, State and Local Revenues: Urban 2,523,861 $ 662,767 $ $ 3,653,793 $ $ 2,317,192 $ $ 1,146,566 $ 1,613,684 $ 738,723 $ $ 598,500 $ 13,310,749 $ Rural Combined 2,523,861 $ 662,767 $ 499,286 $ 3,653,793 $ 1,214,000 $ 3,367,192 $ 1,318,807 $ 1,220,606 $ 2,363,684 $ 849,092 $ 309,923 $ 598,500 $ 18,581,510 $ FY21 Adj. Budget % Change 2,476,163 $ 668,516 $ 497,414 $ 6,919,178 $ 1,893,100 $ 2,521,644 $ 1,351,950 $ 1,220,606 $ 2,250,000 $ 842,333 $ - $ - $ 20,640,904 $ $ $ $ $ 1,214,000 $ 1,050,000 $ 1,318,807 $ $ 750,000 $ 110,369 $ 309,923 $ $ 5,270,761 $ - - 1.9% -0.9% 0.4% -47.2% -35.9% 33.5% -2.5% 0.0% 5.1% 0.8% 55,663 443,623 - - - 74,040 - - -10.0% Operating Revenue Passenger Revenue Paratransit Fare Advertising Revenue Interest Earnings Miscellaneous Revenue Sales of Equipment Medicaid Purchase of Service Revenue Misc. Purchase of Service Total Operating Revenue: $ $ $ $ $ $ $ $ 1,321,906 $ 990,000 134,016 150,000 $ $ $ $ $ $ 1,771,216 $ $ 1,944,919 $ 61,000 $ $ $ $ $ $ $ $ $ 1,051,000 134,016 180,000 9,700 2,250 3,000 1,771,216 115,643 3,266,825 $ $ $ $ $ $ $ $ $ - - - 30,000 9,000 180,000 9,700 56,750 3,000 1,690,975 114,265 2,054,689 0% 0% 700 2,250 1,000 - 43,939 - -96% 0% 5% 1% 59% 2,000 71,703 Total Revenue: 14,632,654 $ 7,215,680 $ 21,848,335 $ $ 22,695,594 -3.7% FY22 REVENUES 4
FY22 URBAN REVENUE (BREAKDOWN) 5
FY22 RURAL REVENUE (BREAKDOWN) 6
FY21 Adj. Budget $9,922,019 $2,387,823 $6,341,580 $1,192,615 $3,804,518 $1,934,133 $65,995 $125,000 $2,784,338 $2,826,167 $1,343,544 $65,705 $2,500 $583,867 $830,551 $93,720 % of budget change -0.3% 4.4% -1.9% -1.2% 3.8% -0.1% 0.0% 0.0% -11.0% -0.5% 0.0% 0.0% 300.0% -3.4% 0.0% 0.0% -59.7% 0.0% -3.7% Urban Rural Combined SALARIES AND WAGES $6,651,136 $1,478,538 $4,171,492 $1,001,106 $2,940,884 $1,311,635 $36,225 $100,000 $1,723,936 $1,379,863 $1,342,997 $19,833 $10,000 $3,239,100 $1,013,470 $2,047,980 $177,650 $1,008,053 $620,296 $29,770 $25,000 $753,220 $1,433,155 $9,890,236 $2,492,008 $6,219,472 $1,178,756 $3,948,936 $1,931,931 $65,995 $125,000 $2,477,156 $2,813,018 $1,342,997 $65,705 $10,000 $563,765 $830,551 $93,720 $46,443 $455,900 Admin Wages Driver Wages Maintenance Wages PERSONNEL TAXES AND BENEFITS GENERAL AND ADMIN EXPENSES OPERATIONS EXPENSES PLANNING EXPENSES MAINTENANCE EXPENSES CONTRACTOR EXPENSES ADA Paratransit Partner Local Share Functional Assessments Volunteer Drivers Other Transportation Svcs $0 $45,872 $0 $0 $563,765 $823,518 $25,400 $7,033 $68,320 $46,443 $356,600 (17,612) $14,597,431 MARKETING EXPENSE DEBT SERVICE CAPITAL MATCH FUND COST ALLOCATIONS TOTAL EXPENSES $0 $0 $99,300 17,612 $7,250,905 $21,848,335 $22,687,380 $1,131,490 $0 - FY22 EXPENSES 7
Total Expenses Total Revenues Municipal Assessments Local Contributions $21,848,335 $21,848,335 $3,186,628 $499,286 FY22 REVENUES & EXPENSES SUMMARY Urban Municipal assessments are approximately 14.6% of total revenues. Local Contributions are approximately 2.3% of total revenues 8
FY22 MUNICIPAL ASSESSMENTS GMT s Charter includes assessments of GMT s member municipalities: Burlington, South Burlington, Winooski, Essex, Shelburne, Williston, Milton, Hinesburg, & Colchester (non-voting member) On March 18, 2020, the Town of Colchester entered into an agreement as of July 1, 2020 to become a non-voting member of GMT for a term of 6 years. As a result, the Town of Colchester agreed to a capital buy-in program and will receive both the benefits and commitments included with membership. Assessment Components Fixed Route based on level of service in community Capital Match Capital funding for support of fixed route services and facilities Special Assessments - Non-Fare Services or other service agreements, generally affiliated with fixed route services ADA Paratransit based on number of trips taken by residents of a community in the most recently fiscal year end 9
FY22 Assessments Fixed Route ADA Paratransit Burlington Total Burlington % of Total $1,458,325 $203,768 $1,662,093 FY22 Assessments Fixed Route ADA Paratransit So. Burlington Total So. Burl. $321,446 $207,025 $528,471 % of Total 61% 39% 100% FY22 Assessments Fixed Route ADA Paratransit Essex Total Essex $218,552 $71,840 $290,392 % of Total 75% 25% 100% 88% 12% 100% FY22 Assessments Fixed Route ADA Paratransit Winooski Total Winooski $111,729 $91,675 $203,404 % of Total 55% 45% 100% FY22 Assessments Fixed Route ADA Paratransit Shelburne Total Shelburne % of Total $63,154 $37,768 $100,922 FY22 Assessments Fixed Route Capital Buy-in ADA Paratransit Colchester Total Colchester % of Total $45,116 $20,256 $26,256 $91,628 63% 37% 100% 49% 22% 29% 100% FY22 Assessments Fixed Route ADA Paratransit Williston Total Williston $206,122 $24,436 $230,557 % of Total 89% 11% 100% FY22 Assessments Fixed Route ADA Paratransit Milton Total Milton $35,037 NA $35,037 % of Total 100% NA 100% FY22 Assessments Fixed Route ADA Paratransit Milton Total Hinesburg % of Total $46,748 NA $46,748 100% NA 100% FY22 Assessments Fixed Route ADA Paratransit Total Assessments Total % of Total 79% 21% 100% $2,526,486 $662,767 $3,189,253 FY22 PROJECTED ASSESSMENTS 10
Burlington Fixed Route $1,458,325 $1,458,325 Paratransit $203,768 Total $1,662,093 $1,662,093 FY22 FY21 % Change 0.0% 0.0% 0.0% Essex FY22 $210,437 $65,652 $276,090 FY21 $218,552 $71,840 $290,392 % Change -3.7% -8.6% -4.9% Fixed Route Paratransit Total $203,768 Winooski Fixed Route Paratransit Total FY22 $111,729 $91,675 $203,404 FY21 $111,729 $91,675 $203,404 % Change 0% 0% 0% Shelburne Fixed Route Paratransit Total FY22 $60,809 $45,758 $106,567 FY21 $63,154 $37,768 $100,922 % Change 3.9% -17.5% -5.3% FY22 VS. FY21 ASSESSMENTS Williston Fixed Route Paratransit Total FY22 $198,469 $24,504 $222,973 FY21 $206,122 $24,436 $230,557 % Change -3.7% 0.3% -3.3% Milton Fixed Route Paratransit Total FY22 $33,737 NA $33,737 FY21 $35,037 NA $35,037 % Change -4% NA -4% So. Burl. Fixed Route Paratransit Total FY22 $309,609 $189,653 $499,262 FY21 $321,446 $207,025 $528,471 % Change -3.7% -8.4% -5.5% Colchester Fixed Route Paratransit Total FY22 NA $28,587 $28,587 FY21 NA $26,256 $26,256 % Change NA 8.9% 8.9% Hinesburg Fixed Route Paratransit Total FY22 $45,012 NA $45,012 FY21 $46,748 NA $46,748 % Change -3.7% NA -3.7% Total FY22 FY21 % Change -1.9% 0.9% -1.3% Fixed Route $2,478,788 $2,526,486 Paratransit $668,516 Total $3,147,304 $3,189,253 $662,767 11
Questions? 12
