Guadalupe County Hospital Meeting Agenda
Explore the agenda for Meeting #2 at Guadalupe County Hospital, covering topics such as economic and demographic data, health indicators, survey questionnaires, and more.
Uploaded on | 0 Views
Download Presentation

Please find below an Image/Link to download the presentation.
The content on the website is provided AS IS for your information and personal use only. It may not be sold, licensed, or shared on other websites without obtaining consent from the author. If you encounter any issues during the download, it is possible that the publisher has removed the file from their server.
You are allowed to download the files provided on this website for personal or commercial use, subject to the condition that they are used lawfully. All files are the property of their respective owners.
The content on the website is provided AS IS for your information and personal use only. It may not be sold, licensed, or shared on other websites without obtaining consent from the author.
E N D
Presentation Transcript
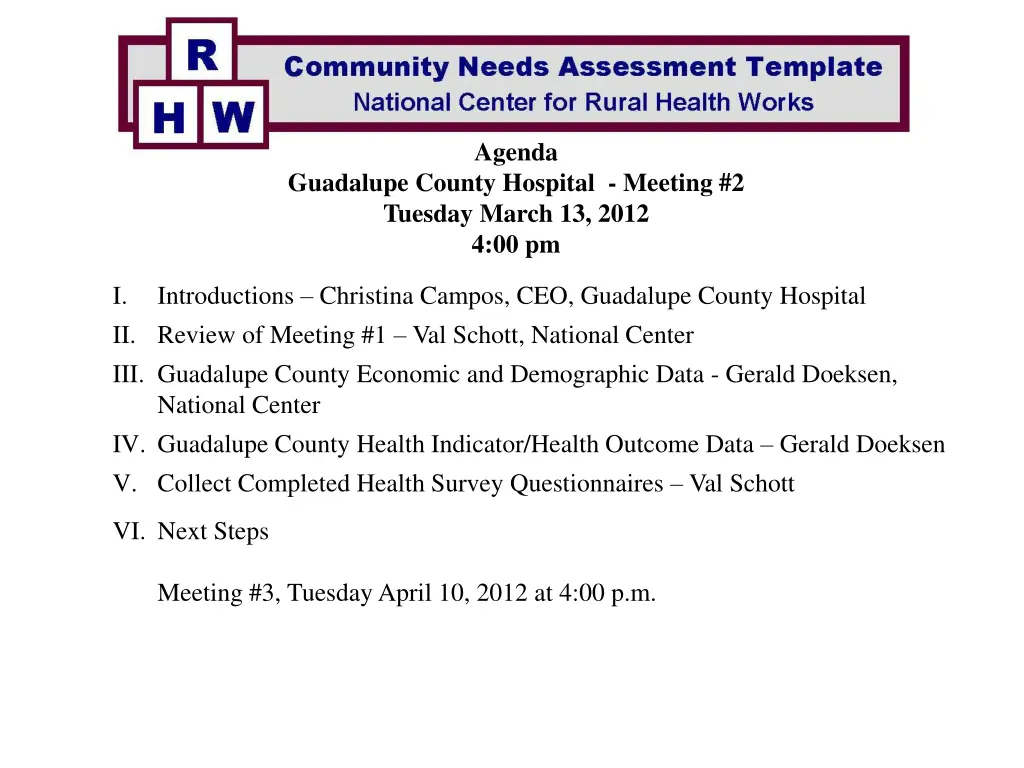
Agenda Guadalupe County Hospital - Meeting #2 Tuesday March 13, 2012 4:00 pm I. II. Review of Meeting #1 Val Schott, National Center III. Guadalupe County Economic and Demographic Data - Gerald Doeksen, National Center IV. Guadalupe County Health Indicator/Health Outcome Data Gerald Doeksen V. Collect Completed Health Survey Questionnaires Val Schott Introductions Christina Campos, CEO, Guadalupe County Hospital VI. Next Steps Meeting #3, Tuesday April 10, 2012 at 4:00 p.m.
Table 2 Populations by Race and Hispanic Origin for Guadalupe County and the State of New Mexico Native American1 Two or More Races3 Hispanic Origin4 White Black Other2 Total 2000 Census Santa Rosa City 1,577 60 48 934 125 2,744 2,227 Rural Area 669 2 3 684 39 1,397 1,105 Guadalupe County Percent 2,530 54.1% 62 53 1,855 39.6% 180 3.8% 4,680 100.0% 3,801 81.2% 1.3% 1.1% State of New Mexico Percent 1,214,253 66.8% 34,343 1.9% 173,483 9.5% 330,640 18.2% 66,327 3.6% 1,819,046 100.0% 765,386 42.1% 2010 Census Santa Rosa City 1,971 68 57 654 98 2,848 2,262 Rural Area 694 3 13 174 32 916 677 Guadalupe County Percent 3,298 70.4% 79 90 1,066 22.7% 154 3.3% 4,687 100.0% 3,730 79.6% 1.7% 1.9% State of New Mexico Percent 1,407,876 68.4% 42,550 2.1% 193,222 9.4% 338,521 16.4% 77,010 3.7% 2,059,179 100.0% 953,403 46.3%
Table 3 Populations by Age Group for Guadalupe County and the State of New Mexico Age Groups 25-44 0-14 15-19 20-24 45-64 65+ Total 2000 Census Santa Rosa City 505 211 205 944 549 330 2,744 Rural Area 288 114 69 360 338 228 1,397 Guadalupe County Percent 908 365 7.8% 298 6.4% 1,437 30.7% 1,024 21.9% 648 4,680 100.0% 19.4% 13.8% State of New Mexico Percent 419,108 23.0% 145,751 8.0% 121,291 6.7% 516,100 28.4% 404,571 22.2% 212,225 11.7% 1,819,046 100.0% 2010 Census Santa Rosa City 483 168 202 886 743 366 2,848 Rural Area 170 53 42 166 343 142 916 Guadalupe County Percent 836 287 6.1% 278 5.9% 1,219 26.0% 1,339 28.6% 728 4,687 100.0% 17.8% 15.5% State of New Mexico Percent 429,980 20.9% 149,861 7.3% 142,370 6.9% 515,768 25.0% 548,945 26.7% 272,255 13.2% 2,059,179 100.0%
Table 4 Population, Projections, and Percent Change for Guadalupe County and the State of New Mexico Census 2010 Population Projections 2020 2015 2025 2030 Guadalupe County % Change from 2010 4,687 5,553 5,961 6,328 6,717 18.5% 27.2% 35.0% 43.3% State of New Mexico % Change from 2010 2,059,179 2,356,236 2,540,145 2,707,757 2,864,796 14.4% 23.4% 31.5% 39.1%
Table 5 Full- & Part-Time Employment by Type of Employment & by Major Industry (NAICS)1 for Guadalupe County and the State of New Mexico, 2009 Guadalupe County No. of % of Jobs Total 2,019 1,439 580 217 363 New Mexico % of Total 100.0% 79.1% 20.9% 7.8% 92.2% % of Private % of Private Total full- & part-time employment Wage & salary employment Proprietors' employment Farm proprietors' employment Nonfarm proprietors' employment2 By Industry: Farm employment Nonfarm employment Private employment Construction Retail trade Transportation & warehousing Health care & social assistance Accommodation & food services Other services, except public admin Sum of (D) and (L) Categories3 Government & government enterprises 100.0% 71.3% 28.7% 37.4% 62.6% 258 1,761 1,276 103 260 12.8% 87.2% 72.5% 2.3% 97.7% 79.4% 100.0% 8.1% 20.4% 5.0% 12.2% 32.5% 5.7% 16.1% 100.0% 8.1% 13.5% 2.9% 14.2% 9.8% 6.2% 64 156 415 73 205 485 27.5% 20.6%
Table 6 Personal Income Earnings by Place of Work and by Industry (NAICS)1 for Guadalupe County and the State of New Mexico, 2009 Guadalupe County Income ($1,000s) 58,321 38,422 9,299 10,600 New Mexico % of Total 100.0% 71.6% 9.9% 18.6% % of Total 100.0% 65.9% 15.9% 18.2% % of Private % of Private Total earnings by place of work Wage & salary disbursements Proprietors' income2 All other earnings Earnings by Industry Total earnings by industry Farm earnings Nonfarm earnings Private earnings Construction Retail trade Transportation & warehousing Educational services Health care & social assistance Other services, except public admin Sum of (D) & (L) Categories3 Government & government enterprises 58,321 5,650 52,671 32,819 4,128 6,188 2,136 100.0% 9.7% 90.3% 62.3% 100.0% 1.2% 98.8% 71.6% 100.0% 12.6% 18.9% 6.5% 0.2% 19.5% 8.6% 11.2% 100.0% 8.6% 9.7% 3.7% 1.2% 15.7% 5.2% 64 6,405 2,818 3,679 19,852 37.7% 28.4%
Table 7 Transfer Receipts for Guadalupe County and the State of New Mexico, 2009 Guadalupe County State of New Mexico Receipts* % of Receipts* % of ($1,000s) Total ($1,000s) Total Total personal current transfer receipts 44,879 100.0% 14,345,809 100.0% Receipts of individuals from govts 44,106 98.3% 13,981,149 97.5% Ret. & disab. ins. benefits 10,445 23.3% 4,313,600 30.1% Old-age, surv & disab ins benefits 9,835 21.9% 4,165,644 29.0% Railroad ret & disab benefits 556 1.2% 86,408 0.6% Workers' comp (L) ** 55,809 0.4% Other govt ret & disab ins benefits1 (L) ** 5,739 0.0% Medical benefits 24,494 54.6% 6,225,189 43.4% Medicare benefits 8,683 19.3% 2,623,849 18.3% Public asst medical care benefits2 15,761 35.1% 3,524,253 24.6% Military medical insurance benefits3 50 0.1% 77,087 0.5%
Table 8 Economic Indicators for Guadalupe County and the State of New Mexico Guadalupe County State of New Mexico Indicator Total Personal Income (2009) Per Capita Income (2009) 105,946,000 24,981 66,856,080,000 33,267 Employment (2010) Unemployment (2010) Unemployment Rate (2010) 1,618 187 10.4% 873,112 80,202 8.4% Employment (2011) Unemployment (2011) Unemployment Rate (2011) 1,592 178 10.0% 873,656 67,227 7.1% % of People in Poverty (2010) % of Under 18 in Poverty (2010) 23.7% 30.5% 19.8% 28.5% Transfer Receipt Dollars (2009) Transfer Dollars as Percentage of Total Personal Income (2009) 44,879,000 14,345,809,000 42.4% 21.5%
Table 1 Guadalupe County State of New Mexico Health Factors Health Behaviors Adult obesity - BMI 30 Teen birth rate - ages 15-19 Clinical Care Uninsured adults - under age 65 Diabetic screening - Diabetic Medicare enrollees Children in Poverty-Under 18 in Poverty 23.0% 27.0% 62 64 26.0% 83.0% 31.0% 30.0% 70.0% 24.0%
Table 2 Access to Care for Guadalupe County, New Mexico ACCESS TO CARE Guadalupe Co., NM In addition to use of services, access to care may be characterized by medical care coverage and service availability. Uninsured individuals (age under 65) Medicare beneficiaries2 Elderly (age 65+) Disabled Medicaid beneficiaries Primary care physicians per 100,000 population Dentists per 100,000 population Community/Migrant Health Centers Health Professional Shortage Area 839 662 199 1,417 69 0 Yes Yes
Continued Guadalupe County, NM
Table 7 Births by Race for Guadalupe County and the State of New Mexico Guadalupe County 2009 No. New Mexico 2009 % No. % White Black Hispanic Other1 Unknown/Not Reported 2 0 5.6% 0.0% 94.4% 0.0% 0.0% 8,186 616 15,328 4,558 185 28.4% 2.1% 53.1% 15.8% 0.6% 34 0 0 Total Births 36 100.0% 28,873 100.0%
Table 8 Birth's by Mother's Age for Guadalupe County and the State of New Mexico Guadalupe County 2009 State of New Mexico 2009 Age Groups No. % No. % 10-17 18-19 20-29 30-39 40-49 50+1 2 2 5.6% 5.6% 61.1% 27.8% 0.0% 0.0% 1,531 2,930 16,580 7,231 597 5.3% 10.1% 57.4% 25.0% 2.1% 0.0% 22 10 0 0 3 Unknown/ Not Reported 0 0.0% 4 0.0% Total Births 36 100.0% 28,873 100.0%
Table 16 Health Characteristics From Community Health Highlights for Guadalupe County and the State of New Mexico Guadalupe County 19.9 50.8 New Mexico Comparison to State 24 43.6 Health Characteristic Youth Smoking Prevalence (2009) Adolescent Physical Activity (2007) % of Adolescents who ate 5+ Servings of Fruits and Veggies Daily (2003-2009) Youth (Grades 9-12) with Caring and Supportive Relationship in the Family (2009) Alcohol-Related Deaths per 100,000 Population (2007-2009) Watch Watch 19.6 20.9 Improvement Needed 72.7 54.1 Excellent 101.8 52.9 Improvement Needed
Table 16 Continued Health Characteristics From Community Health Highlights for Guadalupe County and the State of New Mexico Alcohol-Related Chronic Disease Deaths per 100,000 Population (2007-2009) Improvement Needed 69.5 23.9 Alcohol Related Injury Death Rates per 100,000 Population (2007-2009) Improvement Needed 32.2 29.0 Drug-Induced Deaths per 100,000 Population (2007-2009) Improvement Needed 27.1 22.8 Health Insurance Coverage; % Uninsured, Under 65 Years (2009) 30.6 22.9 Reason for Concern Medicaid Enrollment; Avg Monthly % of Population (2010) 26.9 23.4 NA Primary Care Providers; Ratio of Population to Providers (2008) 1440 832 NA Prenatal Care in First Trimester (2008-2009) 68.2 52.0 Excellent
Table 16 Continued Health Characteristics From Community Health Highlights for Guadalupe County and the State of New Mexico % of Live Born Infants with Low Birthweight (2008-2010) 12.7 8.5 Improvement Needed Teen Birth Rate; Births per 1000 Girls Age 15- 17 (2007-2009) Chlamydia Cases per 100,000 Population (2010) 21.3 31.6 Watch 666.7 557.9 NA Diseases of the Heart Death Rate per 100,000 population (2007-2009) 384.4 203.8 Reason for Concern Stroke Death Rate per 100,000 population (2005-2009) 73 38.2 Improvement Needed Diabetes Deaths per 100,000 population (2008- 2010) 32.5 32.5 Watch
Table 16 Continued Health Characteristics From Community Health Highlights for Guadalupe County and the State of New Mexico Adolescent Obesity (BMI 95th percentile) (2001-2009) 18.7 13.5 Reason for Concern Female Breast Cancer Deaths per 100,000 population (2001-2005) 62 22.1 Improvement Needed Influenza and Pneumonia Deaths per 100,000 Population (2006-2009) 10.8 20.6 Watch Unintentional Injury Death Rates per 100,000 population (2003-2007) 88.6 62.3 Improvement Needed Motor Vehicle Traffic Crash Deaths per 100,000 population (2005-2009) 31 18.3 Improvement Needed Suicide Death Rates per 100,000 population (2007-2009) 12.9 18.6 Watch
Table 16 Continued Health Characteristics From Community Health Highlights for Guadalupe County and the State of New Mexico Ratio of Total Substantiated Child Abuse Allegations per 1000 child population (2010) 39.4 18.5 Improvement Needed % of Youth Who Felt Sad or Hopeless Almost Every day (2001-2009) 28.9 29.7 Watch Life Expectancy from Age 65 in avg. number of years (2005-2009) Children (Under Age 18) Living in Poverty (2009) 17.89 18.7 NA 32 28.8 Improvement Needed High School Graduation Rate (2010) 84.7 67.3 Excellent
Agenda Guadalupe County Hospital - Meeting #2 Tuesday March 13, 2012 4:00 pm I. Introductions Christina Campos, CEO, Guadalupe County Hospital II. Review Prior Two Meetings Val Schott, National Center III. Health Survey Results - Gerald Doeksen, National Center IV. Develop Community Action Plan Val Schott and Gerald Doeksen A. List Community Health Issues B. Prioritize Community Health Issues C. Discuss Possible Resolution for Health Issues D. Summarize Community Recommendations E. Hospital CEO Response- Christina Campos V. Next Steps R R Community Health Needs Assessment Template H H W W National Center for Rural Health Works
For Additional Information: Please contact: Phone: 405-744-6083 Gerald Doeksen, Executive Director Email: gad@okstate.edu or Cheryl F. St. Clair, Associate Director Email: cheryl@okstate.edu Phone: 405-744-6083 or 98245 National Center for Rural Health Works Oklahoma State University R R Community Health Needs Assessment Template H H W W National Center for Rural Health Works


