Guided Procedure for Cell Counting
Learn how to accurately count red and white blood cells using a step-by-step procedure. Utilize a transparency sheet with a Box Counter, set magnification to 80x, and follow the detailed instructions for counting and recording cell numbers. Understand the process of random sampling and data analysis to draw conclusions about cell concentration. View example data illustrating cell count calculations and differences between healthy and unhealthy blood samples.

Download Presentation

Please find below an Image/Link to download the presentation.
The content on the website is provided AS IS for your information and personal use only. It may not be sold, licensed, or shared on other websites without obtaining consent from the author. If you encounter any issues during the download, it is possible that the publisher has removed the file from their server.
You are allowed to download the files provided on this website for personal or commercial use, subject to the condition that they are used lawfully. All files are the property of their respective owners.
The content on the website is provided AS IS for your information and personal use only. It may not be sold, licensed, or shared on other websites without obtaining consent from the author.
E N D
Presentation Transcript
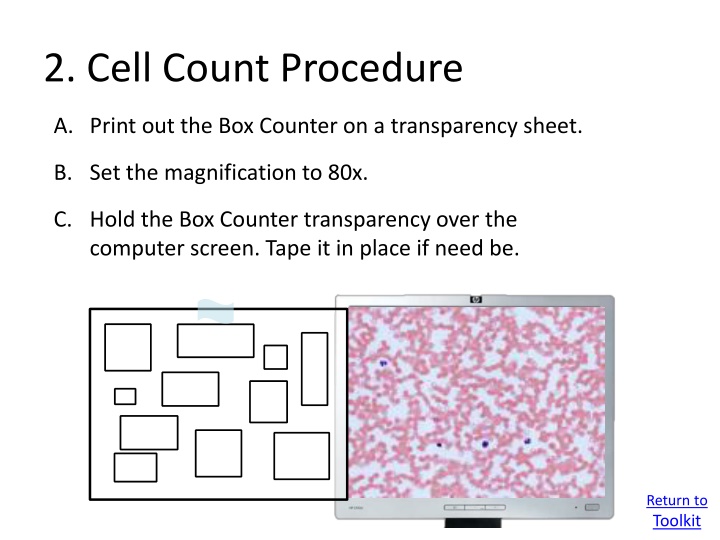
2. Cell Count Procedure A. Print out the Box Counter on a transparency sheet. B. Set the magnification to 80x. C. Hold the Box Counter transparency over the computer screen. Tape it in place if need be. Return to Toolkit
2. Cell Count Procedure A. B. C. D. Students will do a separate count for red blood cells and white blood cells. Print out the Box Counter on a transparency sheet. Set the magnification to 80x. Hold the Box Counter transparency over the computer screen. Tape it in place if need be. E. Count the number of cells inside each box, including ones touching the boxes borders to provide a random sampling that represents the whole. F. Record the numbers in the worksheet and add up totals. A. B. C. D. E. F. G. Move to a new area and repeat two or more times. Print out the Box Counter on a transparency sheet. Set the magnification to 80x. Hold the Box Counter transparency over the computer screen. Tape it in place if need be. Students will do a separate count for red blood cells and white blood cells. Count the number of cells inside each box, including ones touching the boxes borders. Record the numbers in the worksheet and add up totals. Note: stacked overlapped red blood cells Regarding stacked overlapped blood cells in the abnormal blood sample, the best we can do is to count the curved lines (edges of cells) in a stacked group and an estimate here is required.
Normal blood 127 RBC vs 1 WBC Abnormal blood 72 RBC vs 14 WBC
2. Cell Count - Example Data Unhealthy Blood Healthy Blood RBC WBC WBC RBC 28 15 25 23 30 ... 40 0 1 0 0 1 ... 1 8 15 5 14 8 ... 6 10 7 6 4 5 ... 5 Total Cells Counted 2 62 633 237 62/ 237 = .262 2/ 633= .003 Ratio of cells Magnitude of difference .262/ .003 = 83 times Conclusion : white blood cells are 83 times more concentrated in the abnormal blood.