Guidelines for Effective Data Table Presentation
Create neat and organized data tables by following these steps: arrange data vertically, box it in, use rulers for straight lines, label columns with headers and units, title tables above the data, and fill in data accurately. Afterwards, turn the data table into a graph with clear axes and proper labeling.

Download Presentation

Please find below an Image/Link to download the presentation.
The content on the website is provided AS IS for your information and personal use only. It may not be sold, licensed, or shared on other websites without obtaining consent from the author.If you encounter any issues during the download, it is possible that the publisher has removed the file from their server.
You are allowed to download the files provided on this website for personal or commercial use, subject to the condition that they are used lawfully. All files are the property of their respective owners.
The content on the website is provided AS IS for your information and personal use only. It may not be sold, licensed, or shared on other websites without obtaining consent from the author.
E N D
Presentation Transcript
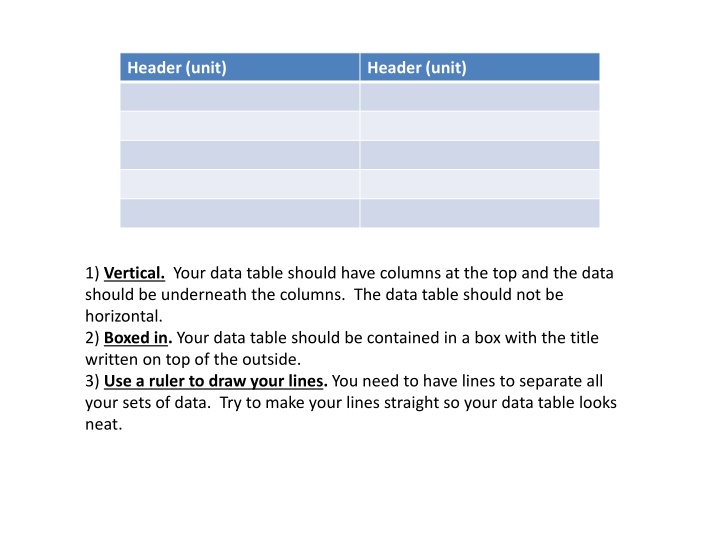
Header (unit) Header (unit) 1) Vertical. Your data table should have columns at the top and the data should be underneath the columns. The data table should not be horizontal. 2) Boxed in. Your data table should be contained in a box with the title written on top of the outside. 3) Use a ruler to draw your lines. You need to have lines to separate all your sets of data. Try to make your lines straight so your data table looks neat.
Time (weeks) Height (cm) 4) Label the top each column with the header. You should also have units (if they apply) with your labels. The independent variable should always in the column on the left and the dependent should always be on the right. Do not keep writing the unit of measure in after each number. It should only be in parenthesis after the label in the top of your data table.
Plant height growth over 5 weeks Time (weeks) Height (cm) 5) Title. The title includes both independent variable and dependent variable. The title should be above the data table
Plant height growth over 5 weeks Time (weeks) Height (cm) 1 4 2 11 3 4 5 6) Fill in the data you have for the independent variable before the experiment begins. As you collect data for your dependent variable during lab put it in correct box. Do not keep writing the unit of measure in after each number. It should only be in parenthesis after the label in the top of your data table.
Plant height growth over 5 weeks Time (weeks) Height (cm) 1 4 2 11 3 15 4 20 5 22 Tada! Your data table is complete!
Now, we will take the data table we created and turn that into a graph. The graphs we create in science class are different than those created in math class. The rules for making a graph are a little different. Your graph is a picture of your data, you want that picture to be as big and clear as possible so you can easily analyze it and draw conclusions.
1) An X and Y axis drawn with a ruler- Leave some space to label the axis below the line.
2) Label on each axes- The X axis is the horizontal line and is labeled with the independent variable. The Y axis is the vertical line labeled with the dependent variable. * If labels have units make sure to include them in parenthesis next to the label. For example-Time (sec)
3) Title- The title includes bothindependent variable and dependent variable.
4) The origin of the graph is always zero- Do not start numbering axis with your first number to plot. Do not connect your first data point to the origin (unless you have data for zero) 5) Evenly spaced increments on axis-If you count by 5 you must continue to count by 5 for the entire axis. You should also number all the way along the axis. Do not use break symbols as used in math graphs. 6) Make hatch marks on the axis- this shows you where on the axis the number belongs.
7) Use all available space- If you use the method on the next page for scaling your axes your graph will be properly spread out. 8) And 9) do not apply to this graph. 10) Small plots- You want your plot to be a point not a large circle. 11) Connect the data points with a ruler.
")
")


 An X and Y axis drawn with a ruler- Leave")
 Label on each axes- The X axis is the horizontal line")
 Title- The title includes bothindependent")
 The origin of the graph is always zero- Do not start")
 Use all available space- If you use the")