Explore the health and health care statistics for Asian Americans, Native Hawaiians, and other Pacific Islanders in the United States as of May 2019. Discover population distribution, socioeconomic factors, and health disparities among different ethnic groups.
Please find below an Image/Link to download the presentation.
The content on the website is provided AS IS for your information and personal use only. It may not be sold, licensed, or shared on other websites without obtaining consent from the author. If you encounter any issues during the download, it is possible that the publisher has removed the file from their server.
You are allowed to download the files provided on this website for personal or commercial use, subject to the condition that they are used lawfully. All files are the property of their respective owners.
The content on the website is provided AS IS for your information and personal use only. It may not be sold, licensed, or shared on other websites without obtaining consent from the author.
E N D
Presentation Transcript
Health and Health Care for Asian Americans, Native Hawaiians and Other Pacific Islanders (NHOPIs) in the United States Updated May 2019
Figure 1 Asians and NHOPIs account for 6% of the total United States population. Nearly 18.2 million individuals self- identify as Asian or NHOPI. Note: Asians and NHOPIs are non-Hispanic. Source: Kaiser Family Foundation analysis of 2017 American Community Survey (ACS), 1-Year Estimates.
Figure 2 Asian and NHOPI populations are made up of diverse groups. DISTRIBUTION OF NONELDERLY ASIAN & NHOPI POPULATIONS, 2017 NHOPI 3% Other Asian 17% Asian Indian 23% Vietnamese 10% Chinese 22% Korean 8% Filipino 15% Japanese 3% Note: Includes nonelderly individuals 0-64 years of age. Asians and NHOPIs are non-Hispanic and exclude individuals of mixed race. Source: Kaiser Family Foundation analysis of 2017 American Community Survey (ACS), 1-Year Estimates.
Figure3 Asians and NHOPIs live across the U.S., but make up a greater share of the population in a few states. DISTRIBUTION OF NONELDERLY ASIAN & NHOPI POPULATIONS BY STATE, 2017 Asian NHOPI CA 31% CA 24% Remaini ng 49 States 51% Remaini ng 48 States 52% HI 25% NY 10% TX 8% Total Asian: 15.5 Million Total NHOPI: 0.5 Million Note: Includes nonelderly individuals 0-64 years of age. Asians and NHOPIs are non-Hispanic and exclude individuals of mixed race. Source: Kaiser Family Foundation analysis of 2017 American Community Survey (ACS), 1-Year Estimates.
Figure4 Most Asians and NHOPIs have a worker in the family and they are more likely to be poor, younger, and non-citizens than Whites. Asian NHOPI White 87%* 84% 83% 57%* 52%* 49% 29%* 16%* 14%* 9%* 8% 2% Full-Time Worker in Family 34 and Younger Family Income Below Poverty Non-Citizen * Indicates statistically significant difference from the White population at the p<0.05 level. Note: Includes nonelderly individuals 0-64 years of age. All racial groups are non-Hispanic and exclude individuals of mixed race. Source: Kaiser Family Foundation analysis of 2017 American Community Survey (ACS), 1-Year Estimates.
Figure5 NHOPIs fare worse than Whites on many health measures. Asians often fare better than Whites, but Asian NHOPI White 31%* 28% 23%* 22% 21% 19% 19%* 16% 14% 12%* 11%* 9% 9%* 8%* 7% 6%* 6%* N/A Problems Paying Medical Bills Fair or Poor Health Status Ever Had Asthma Told By Doctor They Have Diabetes No Mammogram in Past 2 Years (Women 50-74) No Pap Smear in Past 3 Years (Women 21-65) * Indicates statistically significant difference from the White population at the p<0.05 level. Note: Includes nonelderly individuals 18-64 years of age, unless otherwise noted. All racial groups are non-Hispanic and exclude individuals of mixed race. N/A: Estimate does not meet minimum standards for statistical reliability. Source: Kaiser Family Foundation analysis of 2014 National Health Interview Survey (NHIS) and 2016 Behavioral Risk Factor Surveillance System (BRFSS). NHOPI values for Fair/Poor Health Status, Ever Had Asthma, and Problems Paying Medical Bills come from the 2014 NHPI NHIS.
Figure6 health experiences vary among subgroups of Asians. Asian Indian Chinese Filipino Other Asian 18% 9% 9% 8% 8% 7% 6% 5% 5% 6% 3% N/A Fair or Poor Health Status Problems Paying Medical Bills Ever Had Asthma Note: Includes nonelderly individuals 18-64 years of age. All groups are non-Hispanic and exclude individuals of mixed race. N/A: Estimate does not meet minimum standards for statistical reliability. Source: Kaiser Family Foundation analysis of 2017 National Health Interview Survey (NHIS).
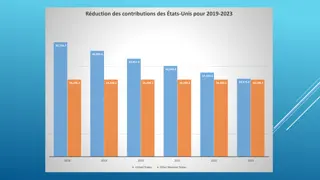
Figure7 The uninsured rate for Asians and NHOPIs declined under the ACA. UNINSURED RATE AMONG NONELDERLY INDIVIDUALS, 2013-2017 18%* 16%* 14%* 11%* 11%* 11%* 12% 10%* NHOPI 8%* Asian 10% 7% 7% White 8% 7% 7% 2013 2014 2015 2016 2017 * Indicates statistically significant difference from the White population at the p<0.05 level. Note: Nonelderly includes individuals 0-64 years of age. All racial groups are non-Hispanic and exclude individuals of mixed race. Source: Kaiser Family Foundation analysis of 2017 American Community Survey (ACS), 1-Year Estimates.
Figure8 However, uninsured rates vary among subgroups of Asians. UNINSURED RATE AMONG NONELDERLY INDIVIDUALS, 2017 10% 9% 9% 7% 6% 5% 4% Asian Indian Korean Chinese Filipino Japanese Vietnamese Other Asian Note: Nonelderly includes individuals 0-64 years of age. All racial groups are non-Hispanic and exclude individuals of mixed race. Source: Kaiser Family Foundation analysis of 2017 American Community Survey (ACS), 1-Year Estimates.