Explore the latest data highlighting the health and health care status of Hispanics in the United States as of May 2019. The information covers population demographics, disparities in health status, and challenges faced by nonelderly Hispanic adults. Figures and statistics reveal trends in areas such as population growth, poverty rates, health conditions, and HIV diagnosis rates among Hispanics compared to Whites. Understanding these insights is crucial for addressing the unique health needs of the Hispanic community in the U.S.
Please find below an Image/Link to download the presentation.
The content on the website is provided AS IS for your information and personal use only. It may not be sold, licensed, or shared on other websites without obtaining consent from the author. If you encounter any issues during the download, it is possible that the publisher has removed the file from their server.
You are allowed to download the files provided on this website for personal or commercial use, subject to the condition that they are used lawfully. All files are the property of their respective owners.
The content on the website is provided AS IS for your information and personal use only. It may not be sold, licensed, or shared on other websites without obtaining consent from the author.
Figure 1 Hispanics account for a large and growing share of the population in the United States. 2017: 2060: About 58 million people living in the U.S. are Hispanic, making up nearly 1 in 5 of the population. Hispanics are projected to account for more than 1 in 4 of the people living in the U.S. by 2060. Source: Kaiser Family Foundation analysis of 2017 American Community Survey (ACS), 1-Year Estimates and U.S. Census Bureau 2017 National Population Projections Tables, https://www.census.gov/data/tables/2017/demo/popproj/2017-summary-tables.html.
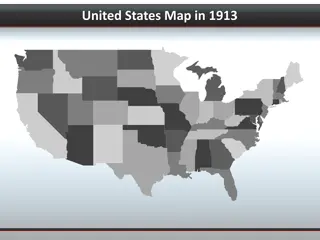
Figure 2 Hispanics make up a greater share of the population in the west. SHARE OF TOTAL POPULATION THAT IS HISPANIC BY STATE, 2017 VT WA ME ND MT NH MN OR MA RI NY WI SD ID MI CT WY PA IA NJ OH NE DE DC IN IL NV MD UT VA CO MO KS KY CA NC TN OK SC AR AZ NM GA MS AL < 5% (12 states) LA TX 5-15% (26 states + DC) AK FL > 15% (12 states) Source: Kaiser Family Foundation analysis of 2017 American Community Survey (ACS), 1-Year Estimates.
Figure3 Most nonelderly Hispanics are in a family with a worker, but they are more likely to be poor. They are also younger and more likely to be a non-citizen than Whites. Hispanic White 84% 84% 63%* 49% 21%* 16%* 8% 2% Full-Time Worker in Family Family Income Below Poverty 34 and Younger Non-Citizen * Indicates statistically significant difference from the White population at the p<0.05 level. Note: Persons of Hispanic origin may be of any race; Whites are non-Hispanic and exclude individuals of mixed race. Includes nonelderly individuals 0-64 years of age. Source: Kaiser Family Foundation analysis of 2017 American Community Survey (ACS), 1-Year Estimates.
Figure4 Hispanics face a range of health challenges. HEALTH STATUS AND SELECTED HEALTH CONDITIONS AMONG NONELDERLY ADULTS (18-64) Hispanic White 33% 30% 11% 9% 9% 7% Fair or Poor Health Status Obese Told By Doctor They Have Diabetes Note: Persons of Hispanic origin may be of any race; Whites are non-Hispanic and exclude individuals of mixed race. Includes nonelderly adults 18-64 years of age. All values have a statistically significant difference from the White population at the p<0.05 level. Source: Kaiser Family Foundation analysis of 2017 National Health Interview Survey (NHIS) and 2017 Behavioral Risk Factor Surveillance System (BRFSS).
Figure5 Hispanics are more than 3 times as likely to be diagnosed with HIV and have a more than 2 times higher teen birth rate than Whites. Hispanic White 29 21 13 6 HIV Diagnosis Rate Among Teens and Adults (per 100,000) Birth Rate for Teen Girls Ages 15-19 (per 1,000) Note: HIV diagnosis rates are for ages 13 and older. For birth rate, persons of Hispanic origin may be of any race; Whites are non- Hispanic. Source: Centers for Disease Control and Prevention, National Center for HIV/AIDS, Viral Hepatitis, STD, and TB Prevention (NCHHSTP) AtlasPlus; Martin JA, Hamilton BE, Osterman MJK, Driscoll AK, Drake P. Births: Final data for 2017. National Vital Statistics Reports; vol 67 no 8. Hyattsville, MD: National Center for Health Statistics. 2018.
Figure6 Hispanics face greater barriers to accessing care and receive less care than Whites. Hispanic White 46% 32% 25% 25% 25% 22% 15% 14% 13% 8% Uninsured Went Without Care Due to Cost^ No Usual Source of Care No Health Care Visit^ No Dental Visit^ Note: ^ Indicates in the past 12 months. Persons of Hispanic origin may be of any race; Whites are non-Hispanic and exclude individuals of mixed race. Includes nonelderly individuals 18-64 years of age. Data for uninsured includes nonelderly adults 19-64 years of age. All values have a statistically significant difference from the White population at the p<0.05 level. Source: Kaiser Family Foundation analysis of 2017 American Community Survey (ACS), 2017 National Health Interview Survey (NHIS), and 2017 Behavioral Risk Factor Surveillance System (BRFSS).
Figure7 Hispanics are more likely to have other characteristics that lead to health challenges. Hispanic White 75% 26% 18% 10% 9% 6% 6% 3% Language Other than English Spoken at Home Less than a High School Education Food Insecure Household Parents Report their Children Live in an Unsafe Neighborhood Note: Persons of Hispanic origin may be of any race; Whites are non-Hispanic and exclude individuals of mixed race. Source: U.S. Census Bureau, 2017 American Community Survey 1-Year Estimates (Language Other than English Spoken at Home and Education, both among nonelderly adults, ages 19-64), U.S. Department of Agriculture, Economic Research Services, Household Food Security in the United States in 2017, Child Trends, Neighborhood Safety, 2016.
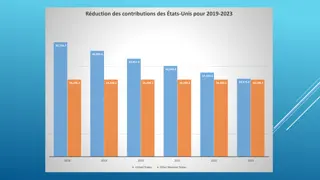
Figure8 Uninsured rate for Hispanics declined under the ACA, but they are still more likely to be uninsured than Whites. Uninsured Rate Among Nonelderly Adults 2013-2017 Uninsured Rate Among Children 2013-2017 Hispanic White 40% 33% 28% 26% 25% 15% 12% 12% 10% 9% 8% 8% 8% 8% 8% 6% 5% 4% 2015 4% 2017 4% 2016 2013 2014 2015 2016 2017 2013 2014 Note: Nonelderly adults are 19-64 years of age. Children are ages 0-18 years. Whites are non-Hispanic and exclude individuals of mixed race. All values have a statistically significant difference from the White population at the p<0.05 level. Source: Kaiser Family Foundation analysis of 2017 American Community Survey (ACS), 1-Year Estimates.