Healthcare Costs: Insights and Comparisons
Explore the causes of high healthcare costs in the US, including over-utilization, administrative expenses, and exorbitant drug prices. Discover comparisons with other countries and insights on physician billing and administrative costs.

Download Presentation

Please find below an Image/Link to download the presentation.
The content on the website is provided AS IS for your information and personal use only. It may not be sold, licensed, or shared on other websites without obtaining consent from the author. If you encounter any issues during the download, it is possible that the publisher has removed the file from their server.
You are allowed to download the files provided on this website for personal or commercial use, subject to the condition that they are used lawfully. All files are the property of their respective owners.
The content on the website is provided AS IS for your information and personal use only. It may not be sold, licensed, or shared on other websites without obtaining consent from the author.
E N D
Presentation Transcript
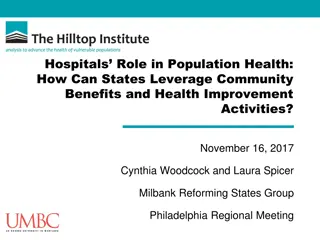
GLOBAL BUDGETS FOR HOSPITALS Stephen B. Kemble, MD Chair, PNHP Policy Committee PNHP-New Hampshire January 26, 2022
Disclosure No financial conflicts of interest to disclose. I receive no money whatsoever for any of my involvement in health care reform and health policy activities.
What is the cause of high cost of U.S. health care?
Over-utilization is not the problem U.S. doctor visits and hospital days per capita are among the lowest among industrialized countries. OECD data Inadequate access to appropriate care driving costly complications is a far greater problem than unnecessary care due to FFS. Excessive administrative cost driving much higher prices is biggest cost driver. Papanicolas, Woskie, Jha. Health Care Spending in the United States and Other High-Income Countries. JAMA 03-13-18 Exorbitant drug prices is 2nd biggest cost driver
Physician Billing Costs US vs Canada Physicians Billing-Related Expenses United States and Canada, 2019 $506 $ per Capita (PPP Adjusted) $91 USA Canada Source: Woolhandler/Campbell/Himmelstein NEJM 2003;349:768 (updated) Note: Excludes dentists and other non-physician office-based practitioners Excludes non-billing-related costs for documentation compliance, etc.
Hospital Billing and Admin Cost Multiple Payers vs Global Budgets Hospital Billing and Administration United States and Canada, 2019 $1,008 $ per Capita (PPP adjusted) $209 USA Canada Woolhandler et al. NEJM 2003;349:768 (updated); Himmelstein et al, Health Aff 9/2014
Healthcare Administrative Costs US vs Canada Overall Administrative Costs per Capita United States and Canada, 2019 $3,953 $982 USA Canada Source: Woolhandler et al. NEJM 2003;349:768 (updated); Himmelstein et al. Health Aff 9/2014
CMS is locked onto a false rationale: To control cost, we must move away from FFS with its volume incentives and replace it with value- based payment shifting insurance risk onto providers of care, paying them up front via capitation and bundled payments, with opportunity to keep more $ by delivering less care. We can eliminate fragmentation and improve quality by organizing doctors and hospitals into Accountable Care Organizations that can accept insurance risk. Or have large insurance plans and hospital chains paid via capitation buy up physician practices and integrate them.
Physician and Hospital Motivation Do doctors and hospitals need financial incentives to want to deliver high quality care? Were they not motivated to do so prior to pay-for-performance and value-based payment ? Do insurance companies know better how to manage care than doctors and hospitals? What about all the time consuming and unnecessary administrative obstacles to quality care and care coordination? Detailed documentation and coding required for payment, and Multiple plans with different networks, different payment policies and fees, different claims denial policies, different formularies, different prior authorization policies, etc.
Budget goals: Reduce admin cost? or financial incentives and risk-shifting? CMS thinks of global budgets as part of value- based payment and shifting insurance risk onto doctors and hospitals, and they are not paying attention to administrative cost. They rely on financial incentives and risk shifting to induce hospitals to restrict care and finance moving more care to less expensive settings Pay-for-quality incentives Eventual goal is capitation and full risk contracting with systems of doctors and hospitals, not minimizing administrative costs.
Capitation vs Budgets Capitation conveys insurance risk fixed payment per person with obligation to cover specified services over specified period of time Opportunity to keep unspent earnings (profit) and risk of loss if more spent than capitated payment Incentive to restrict care, cherry pick and lemon drop Requires risk adjustment (with increased administrative cost) to supposedly counter incentive to cherry pick and lemon drop. Risk adjustment leads to gaming of diagnoses and documentation to beat risk adjustment formulas. Global operating budgets do not convey risk Based on cost of operations, not opportunity for profit or loss Can be adjusted with changing circumstances No retained earnings surplus goes to next year s operating budget, losses covered by supplemental appropriations
Global Budgets - Definitions Global Budgets can mean different things: 1. Fixed pre-payment for a period of time (preferred) Based on cost of operations, not financial incentives Not intended as opportunity for profit or loss e.g. Fire Dept., Police Dept., Schools, etc. 2. Capitation fixed pre-payment per person/member Shifts insurance risk onto providers of care Opportunity for profit or loss Requires defined members and risk adjustment Incentive to restrict care to keep more of capitated budget 3. Price adjustment Adjust prices in accordance with volume to maintain a fixed total budget Taiwan, some Canadian provinces, Germany ambulatory sector
Global Budgeting of Hospitals in Canada and Scotland Canada and Scotland pay hospitals global operating budgets (fixed pre-payment per year) Separate grants for capital needs such as new buildings and expensive new equipment Eliminates hospital billing and collection costs Hospital Admin Costs in 2014: U.S.: 25.3% and rising Canada: 12.42% Scotland: 11.59% A Comparison Of Hospital Administrative Costs In Eight Nations: US Costs Exceed All Others By Far. Health Affairs, Sept. 2014
Marylands evolution 1970s: All-payer rate setting All payers pay hospitals same rates for same services All-payer rate setting stabilized hospital payment and eliminated cost-shifting among insurers, but cost Medicare more by imposing average rates. Minimal reduction in billing and insurance related costs. 2010-13: Total Patient Revenue Budgeting (TPR) Price adjustment budgeting, adjusting FFS prices according to volume TPR budgeting gave incentive to reduce hospital care but required full FFS billing system reconciled to budget retroactively. Minimal admin savings.
Marylands Evolution 2014-17: Global Budget Revenue (GBR) Required all payers to contribute to hospital budgets Applied to hospitals only GBR slowed hospital spending somewhat, but Maryland was still among the most expensive states for Medicare hospital payment (partly due to all-payer rate setting). 2018-23: Total Cost of Care (TCOC) Budgeting Applies to both hospital and non-hospital spending Capitation via attributed members based on where they seek care Payment adjusted according to hospital quality metrics TCOC relies on many adjustments to hospital budgets - complex risk shifting, capitation, P4P incentives high admin cost. Net effect on cost yet to be determined.
Pennsylvania Rural Health Model Several payers (Medicare, Medicaid, some commercial payers) pool funds to pay hospitals with global budgets Not all payers participate, so hospitals must maintain billing and collections departments. Pay-for-performance incentives for hospitals to divert funds to non-hospital services: Improve access to non-hospital care Reduce rural health disparities Reduce deaths from substance abuse and improve care for opioid abuse Closer to fixed pre-payment form of budgeting, but incomplete (less reduction in admin cost) and mixed with P4P and incentives to subsidize non-hospital care
Vermont All-Payer ACO model Very complex. Requires hospitals to track and submit FFS claims and reconcile them to capitated budget (mix of capitation/risk shifting and price adjustment forms of budgeting) Combines OneCare Vermont ACO with Medicaid 1115 waiver, with capitation via attributed membership and lots of P4P incentives: ACO scale targets (70% of all VT insured residents, 90% of Medicare beneficiaries) All-payer and Medicare Financial targets Health outcomes and quality of care targets
Vermont All-Payer ACO results so far NORC at U. of Chicago independent evaluation - August 2021 In PY2 (2019), only 8 of the 15 hospitals in the OneCare provider network participated in all of the VTAPM s ACO payer initiatives (Medicare, Medicaid, and commercial). Hospital administrators voiced frustration about the continued need to submit and track FFS claims for attributed Medicare beneficiaries with the AIPBP, which has posed a challenge for achieving the administrative efficiencies they had anticipated. Due to the reconciliation process, hospitals are reluctant to invest the AIPBP in population health initiatives because they expect CMS to recoup a portion of the funds in the settlement phase. There are no administrative savings at all in this arrangement. It is all incentives to reduce utilization.
Vermont All-Payer ACO results so far Although the All-Payer ACO did achieve some reductions in hospital utilization, non-ACO hospitals achieved even greater reductions, so the reductions may have been in spite of the ACO model, not because of it. Limited hospital and physician participation also limited interpretability of financial results, as there were shifts by patients from ACO to non ACO practices and some of the differences could well have been due to differences in the risk level of populations in each group.
So how can hospital budgets achieve cost- effectiveness?
Connecticut Medicaid Replaced MCOs with PCCM in 2012 Prior to 2012: Full-risk Medicaid Managed Care Organizations Costs rose 45% 2008-2012. 2012: Eliminated Managed Care Organizations, took back insurance risk and self-insured Medicaid, enhanced funding and support for primary care (ePCCM) Contracted necessary administration to Administrative Services Only (ASO) on non-risk basis, by former local managed care plan. 2018: MD acceptance of Medicaid up, ER usage down 25% and hospital admissions and re-admissions down 6%. 6 years later, per member Medicaid costs14% lower than in 2012: $706 pmpm in 2012 to $610 pmpm in 2018 2020: Medicaid admin costs now 2.8%, including ASO compared to 15-40% for Medicaid MCOs, 12.5% for CT commercial plans
Focus on reducing administrative cost Pool hospital funds from all payers in proportion to the hospital needs of each plan s population and pay hospitals with global operating budgets based on cost of operations, not risk-shifting. Eliminates cost-shifting among plans and chargemaster games Eliminates billing and collections, ~15% of a hospital s budget Pay for capital expenditures with a separate fund allocated according to community need. Pay independent physicians with a simplified, standardized fee-for-service fee schedule, regulated by the state. Use collective negotiation to keep fee scale reasonable for all. Would cost less than 2% of the healthcare dollar to administer.
Eliminate fiscal intermediaries State pays providers of care directly, with no fiscal intermediaries State retains insurance risk and covers ups and downs of care costs year to year from reserve fund Necessary administration contracted to Administrative Services Only contractor(s) on non-risk basis: Claims processing Credentialing Administrative support for care coordination programs Quality improvement program administration Customer service Community-based care coordination programs funded with non-risk global operating budgets
Care Coordination without full-risk health plans, HMOs, and ACOs Fund Care Coordination services directly by state on non-risk basis Community-based services for high-risk and special needs patients (Medicaid 1915 waivers) Collaborative Care Model for Psychiatric Consultation to Primary Care. Could also be used for many other specialty consults. Quality Improvement based on professional motivation to improve patient care, not Pay-for- Performance Example of Connecticut Medicaid
Hospital Budgets with Multiple Payers: All- Payer plus Global Budgets State would negotiate with all payers to each pay their share of hospital costs according to hospital needs of their covered populations Pooled hospital funds managed by state Pay hospitals with global operating budgets based on cost of operations (not capitation, price adjustment, or per-service/fee-for-service) Eliminates billing and collections costs (~15% of hospital budgets) Option for physician group practice to join nearby hospital with combined global operating budget; eliminates insurance functions (no closed panel membership or capitated per- member payment, no profit/retained earnings or risk of loss) Pay for capital expenditures separately according to community needs
All-Payer plus Global Budgets for Hospitals: Goals Minimize hospital administrative costs Eliminate cost shifting and chargemaster games Reduce opportunities for billing fraud and abuse Provide predictability and stability for hospital budgets Rescue rural and critical access hospitals
Questions? Contact Info: stephenbkemble@gmail.com (808) 497-6521