Healthcare Reform Analysis and Savings Projections
Explore the proposed healthcare reforms under President Trump and Paul Ryan, contrasted with the economic case for a single-payer system. Understand the potential impacts on coverage, costs, and benefits, supported by data and studies. Learn about Canadian Medicare implementation and its effects on the delivery system.
Download Presentation

Please find below an Image/Link to download the presentation.
The content on the website is provided AS IS for your information and personal use only. It may not be sold, licensed, or shared on other websites without obtaining consent from the author. If you encounter any issues during the download, it is possible that the publisher has removed the file from their server.
You are allowed to download the files provided on this website for personal or commercial use, subject to the condition that they are used lawfully. All files are the property of their respective owners.
The content on the website is provided AS IS for your information and personal use only. It may not be sold, licensed, or shared on other websites without obtaining consent from the author.
E N D
Presentation Transcript
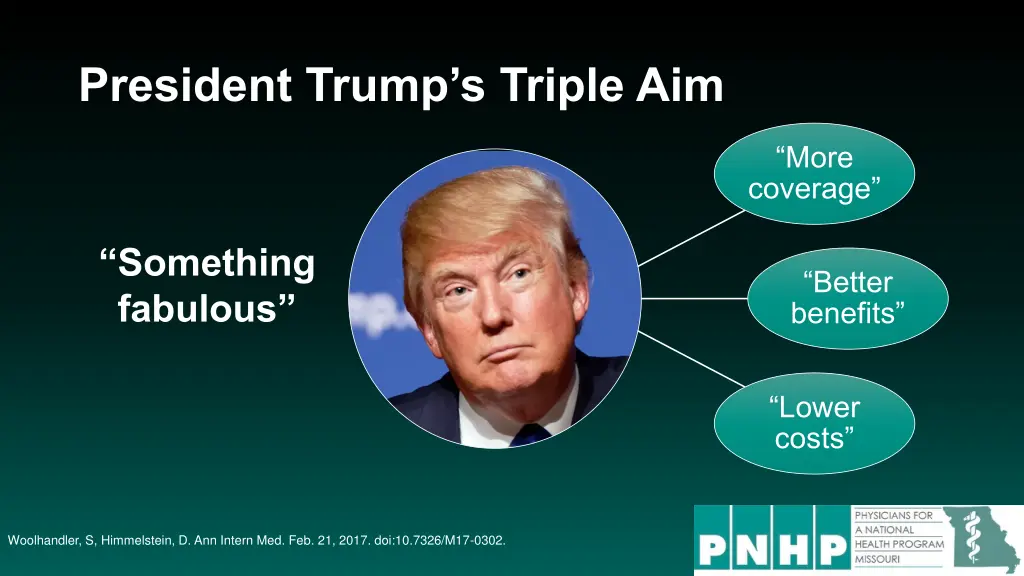
President Trumps Triple Aim More coverage Something fabulous Better benefits Lower costs Woolhandler, S, Himmelstein, D. Ann Intern Med. Feb. 21, 2017. doi:10.7326/M17-0302.
Paul Ryans Blueprint Shifts Costs Onto Patients and States Tax credits for anyone without job-based coverage More funds for the wealthy means less funds for low-income Mini-med plans Miniscule coverage Interstate sales Circumvents state-based consumer protections Augment Health Savings Accounts Boon for those in higher-tax brackets Woolhandler, S, Himmelstein, D. Ann Intern Med. Feb. 21, 2017. doi:10.7326/M17-0302.
Paul Ryans Blueprint Shifts Costs Onto Patients and States Block-grant Medicaid States could divert funds to non-medical purposes Delay Medicare eligibility to age 67 Turn Medicare into vouchers Eliminate guaranteed benefits of Medicare Tied to overall inflation, not to health care inflation Woolhandler, S, Himmelstein, D. Ann Intern Med. Feb. 21, 2017. doi:10.7326/M17-0302.
Economic Case for Single Payer Is Compelling 2017 Spending Without Reform Without Reform 2017 Spending Savings with Single Payer Single Payer Savings with 2017 Savings Savings 2017 Sector Sector Insurance overhead and admin. of public programs Billing and administration administration Insurance overhead and admin. of public programs Billing and $323.3 B $323.3 B 68.0% 68.0% $220.0 B $220.0 B Hospitals Physicians Physicians Hospitals $283.9 B $187.6 B $1091.7 B $1091.7 B $362.7 B $283.9 B $187.6 B 52.6% 40.1% 52.6% 40.1% 46.1% 46.1% 31.2% $149.3 B $75.3 B $503.6 B $503.6 B $113.2 B $616.8 B $149.3 B $75.3 B Total Administration* Total Administration* Outpt Rx drugs Total above *Note: Total Administration includes additional savings for nursing homes, home care agencies, non-physician practitioners, and employers Woolhandler, S, Himmelstein, D. Ann Intern Med. Feb. 21, 2017. doi:10.7326/M17-0302.
25 Studies (State and National) Confirm Savings Would Fund Full Coverage Fully cover the nation 26 million more covered people Eliminate copays and deductibles Plug the coverage gaps Cover missing services (dental, long term care, etc.) Fairness in fees Bring Medicaid fees up to par http://www.pnhp.org/facts/single-payer-system-cost Accessed 2/25/2017
Canadian Medicare Implemented in Montreal 1971 Did Not Overwhelm the Delivery System 7.8 Annual visits per person per year 6 6.6 6.0 5.5 5.3 5.1 5.0 5.0 4.9 4.8 4.7 4.7 4 1969-70 1971-72 2 0 Total Lowest Income Low-Mid Income Middle Income Upper-Mid Income Upper Income http://www.nejm.org/doi/pdf/10.1056/NEJM197311292892206 Annual family income brackets: <$3,000; 3,000-4,999; 5,000-8,999; 9,000-14,999; 15,000+
Canadian Medicare Implemented in Quebec 1971 Care Shifted to Older and Lower Income 15% 10% Age >65 years Age 17 65 years Percentage change in annual visits 1969-70 to 1971-72 5% 0% -5% Age <17 years -10% -15% Total Lower Income Higher Income http://www.nejm.org/doi/pdf/10.1056/NEJM197311292892206 Annual family income brackets: Low income <$9,000; higher income >$9,000
USA Medicare and Medicaid Enactment in 1965 Did Not Overwhelm the Delivery System 844,347 750,000 831,077 Total number of physician visits in USA 500,000 250,000 0 July 1963 - June 1964 July 1966 - June 1967 MD + DO, in person or by telephone for civilian non-institutional USA population Wilder CS. Volume of physician visits. United States July 1966-June 1967. Vital Health Stat 10. 1968;10:1-60. [PMID: 5303847] CDC_12947_DS1.pdf
USA Medicare and Medicaid Enactment in 1965 Did Not Overwhelm the Delivery System 441,351 400,000 Total physician visits across USA 424,218 406,859 390,776 372,401 351,439 300,000 200,000 Jan - Jun 1966 Jul - Dec 1966 Jan - Jun 1967 55,419 51,817 50,576 100,000 0 All Ages Under 65 65+ MD + DO, in person or by telephone for civilian non-institutional USA population Wilder CS. Volume of physician visits. United States July 1966-June 1967. Vital Health Stat 10. 1968;10:1-60. [PMID: 5303847] CDC_12947_DS1.pdf


