Healthcare Spending and Utilization in Medicare Systems
Explore differences in healthcare spending and utilization between Traditional Medicare (TM) and Medicare Advantage (MA) systems, revealing lower spending in MA due to reduced utilization. Discover implications of geographical variation and potential factors influencing differences in medical practice patterns.
Download Presentation

Please find below an Image/Link to download the presentation.
The content on the website is provided AS IS for your information and personal use only. It may not be sold, licensed, or shared on other websites without obtaining consent from the author. If you encounter any issues during the download, it is possible that the publisher has removed the file from their server.
You are allowed to download the files provided on this website for personal or commercial use, subject to the condition that they are used lawfully. All files are the property of their respective owners.
The content on the website is provided AS IS for your information and personal use only. It may not be sold, licensed, or shared on other websites without obtaining consent from the author.
E N D
Presentation Transcript
Healthcare Spending and Utilization in Public and Private Medicare Vilsa Curto, Liran Einav, Amy Finkelstein, Jonathan Levin, and Jay Bhattacharya The Health Sector and The Economy BFI, University of Chicago September 30, 2016 1
Motivation Two very different forms of health insurance provision for the elderly: Public: Traditional Medicare (TM) involves FFS reimbursement of provides Private: Medicare Advantage (MA) involves public payments to regulated private (mostly PPO/HMO) plans who then enroll individuals About 30 percent of enrollees are in MA but all the work on Medicare healthcare spending is on TM Big question: how (and why) does health care spending and medical practice pattern vary across these two systems Differences in overall levels of spending and components Differences in scope and nature of geographic variation 2
Approach Prior work on topic limited by data Medicare enrollees disappear from the claims data when they go into MA Some evidence of lower utilization (Landon et al., 2012; Duggan et al., 2015) Some indirect estimates (e.g. Curto et al., 2015 and others) of savings This paper: newly available data from Health Care Cost Institute (HCCI) allows us to see inside the MA black box HCCI aggregates claims for Aetna, Humana, UnitedHealthcare (~45% of MA) 3
Overview of Findings Level differences in Spending Healthcare spending is 27% lower ($237 / enrollee month) for observably similar people in MA relative to TM Holds across subsets of enrollees and broad categories of spending Primarily reflects lower utilization ( prices are comparable) Geographic variation in spending MA displays somewhat larger geographic variation in spending Smaller geographic variation in prices Areas with higher TM spending have bigger MA savings Treatment vs selection Attempting to adjust for unobservables using mortality differences Raw data has 30% difference; Difference is 27% after adjusting for rich observables Based on mortality adjustment, between 25 and 50 percent of difference may be attributed to a combination of upcoding and selection on unobservables Some suggestive evidence on mechanism e.g. MA has lower rate of discharge to post acute care, more outpatient surgeries, larger declines in specialist care than primary care 4
Outline of Talk 1. 2. 3. Background: Institutions and Data Levels of Spending and Utilization in MA and TM Selection vs. Treatment 5
Outline of Talk 1. 1. 2. 3. Background: Institutions and Data Background: Institutions and Data Levels of Spending and Utilization in MA and TM Selection vs. Treatment 6
Medicare Advantage Allows Medicare beneficiaries to opt out of traditional, fee-for-service Medicare, and enroll in private insurance plans, mostly HMOs & PPOs Plans must provide at least the insurance benefits of standard Medicare (parts A and B), and typically provide more generous financial coverage CMS pays plans a capitated amount for each enrollee plans submit bids that are discounts off a benchmark capitation rate, set county-by-county What we think we already know MA doesn t appear to save money for taxpayers MA enrolls somewhat healthier seniors MA might(?) have lower medical claims cost 7
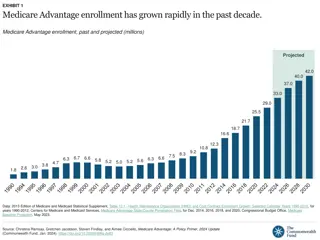
Expansion of Medicare Advantage 35% 35% 30% 30% 25% 25% 20% 20% 15% 15% Data for talk (2010) 10% 10% 5% 5% 0% 0% 8 1985 1985 1990 1990 1995 1995 2000 2000 2005 2005 2010 2010 2015 2015
Why would medical spending be different? Medical spending: payments to medical providers for services (claims) includes insurer and out-of-pocket payments Treatment how insurers reduce spending Limit low value services (gatekeeping, physician incentives) Substitute to cheaper mix of services (also lower quality?) Negotiate lower prices (but perhaps lack CMS bargaining power) Selection On geography (e.g. MA enrollment high in urban areas): we can adjust for this On observed health conditions: we can adjust for this On unobserved health and/or preferences for care: more difficult 9
Data Construction Data for the project CMS. CMS. Beneficiary file with enrollment, demographic, health and mortality information on all TM and MA enrollees CMS. CMS. Claims for all TM enrollees HCCI. HCCI. Claims for enrollees in most Aetna, Humana, UnitedHealthcare ( HCCI Insurers ) plans (2010) Combining Data Sources DUAs don t allow us to combine / match individual data across CMS / HCCI But (as explained shortly) we can adjust CMS data for HCCI characteristics and compare means Sample Selection Using CMS beneficiary file, can identify enrollees in all HCCI Insurer plans HCCI is missing 25% of AHU enrollees. Most missing enrollees/plans are in specific areas (e.g. CA, NV). We restrict to states within 10% of CMS count 10
Baseline sample Data source / sample All CMS Baseline CMS All HCCI Baseline HCCI MA (all insurers) MA (HCCI insurers) MA (all insurers) MA (HCCI insurers) MA (HCCI insurers) MA (HCCI insurers) TM TM (1) (2) (3) (4) (5) (6) (7) (8) Panel A: Enrollee-level summary No. of enrollees (000s) 27,066 10,502 3,904 13,577 4,563 2,016 2,933 2,039 Female 0.574 0.574 0.574 0.577 0.569 0.571 0.569 0.573 Age 75.1 74.3 74.2 75.1 74.2 73.9 -- -- Coarse age: 65-74 0.534 0.569 0.573 0.530 0.575 0.591 0.592 0.588 75-84 0.320 0.318 0.315 0.323 0.319 0.307 0.306 0.309 85+ 0.146 0.113 0.111 0.147 0.107 0.103 0.102 0.103 Dual eligible 0.141 0.122 0.110 0.131 0.074 0.071 -- -- SNP enrollees -- 0.080 0.064 -- 0.000 0.000 0.000 0.000 Risk score 1.074 1.015 1.021 1.082 1.022 1.023 -- -- Died in 2010 0.049 0.036 0.036 0.051 0.036 0.035 -- -- 12
Comparing overall expenditure Data source / sample All CMS Baseline CMS All HCCI Baseline HCCI MA (all insurers) MA (HCCI insurers) MA (all insurers) MA (HCCI insurers) MA (HCCI insurers) MA (HCCI insurers) TM TM (1) (2) (3) (4) (5) (6) (7) (8) Panel B: Spending per enrollee-month No. of enrollee-months (000s) 306,801 117,423 43,738 154,082 51,299 22,649 32,423 22,609 Total Spending ($) 933 -- -- 924 -- -- 639 647 Insurer Spending ($) 793 -- -- 783 -- -- 586 596 OOP Spending ($) 139 -- -- 141 -- -- 53 52 Overall CMS expenditure ($) -- 818 818 -- 778 787 -- -- Actuarial value of incremental consumer benefits ($) -- 63 53 -- 58 53 -- -- Plan receivables for organic MA services ($) -- 799 805 -- 761 776 -- -- 13
Regional Variation 1,100 1,000 MA Spending per enrollee-month 900 PA 800 OH AK DE CT MI 700 LA KY GA RI TN MS SC VA IN NH KS 600 AR WI IL FL UT MO NM HI ID ME 500 500 600 700 800 900 1,000 1,100 TM Spending per enrollee-month Slightly larger coeff. of variation across states in MA (0.13) vs. TM (0.11). 14
Reweighting strategy Reweight TM sample to look like HCCI sample in the spirit of CMS approach (county and risk score) Consider an outcome ?? associated with enrollee ? Average HCCI outcome ????? ; we want a comparable number for TM Define discrete bins ? = 1, ,? (partition of possible Xs). Assign each Medicare beneficiary to his/her bin Let ??be the number of AHU enrollees in b. Let N = ??? Let ??= ??/? be the share of AHU enrollees in bin b Define average TM outcome for each bin: ??,?? Note: If no TM enrollee in bin b, interpolate between closest populated TM risk score bins within county sometimes necessary at high risk scores Reweighted TM outcome: ???= ??? ??,?? 15
Reweighting: Spending results Source Baseline CMS Baseline HCCI Sample TM TM TM TM MA County & County & Reweight by None County None Risk bin 0.5 Risk bin 0.1 (1) (2) (3) (4) (5) No. of enrollee-months (000s) 154,082 154,082 154,082 154,082 22,609 Total Spending ($/month) 924 950 889 884 647 Insurer Spending ($/month) 783 806 753 749 596 OOP Spending ($/month) 141 144 135 135 52 16
Outline of Talk 1. 2. 2. 3. Background: Institutions and Data Levels of Spending and Utilization in MA and TM Levels of Spending and Utilization in MA and TM Selection vs. Treatment 17
Spending by types of enrollees TM, weighteda % MA enrollees TM, unweighted MA Difference (4)-(3) ((4)-(3)) / (3) (1) (2) (3) (4) (5) (6) No. of enrollee-months (000s) 22,609 154,082 154,082 22,609 Total Spending 100% 924 884 647 -237 -26.8% Panel A. Spending ($/month) by enrollee characteristics Male 42.7% 928 887 681 -206 -23.2% Female 57.3% 922 882 623 -260 -29.4% 65-74 56.1% 729 679 544 -134 -19.8% 75-84 32.7% 1,041 1,009 737 -272 -27.0% 85+ 11.2% 1,299 1,312 904 -409 -31.2% Urban 80.7% 952 918 648 -270 -29.4% Rural 19.3% 861 756 646 -110 -14.6% 18
Distribution of Spending TM, weighteda % MA enrollees TM, unweighted MA Difference (4)-(3) ((4)-(3)) / (3) (1) (2) (3) (4) (5) (6) No. of enrollee-months (000s) 22,609 154,082 154,082 22,609 Total Spending 100% 924 884 647 -237 -26.8% Panel B. Realized distribution of spending ($/month) % w/ no spending 0.37 0.38 0.46 0.08 21.6% Median spending 95 90 39 -51 -56.6% 75th pctile 338 330 224 -106 -32.1% 90th pctile 1,339 1,291 859 -432 -33.4% 95th pctile 3,494 3,290 2,179 -1,112 -33.8% 97.5th pctile 8,454 7,863 5,731 -2,132 -27.1% 99th pctile 18,759 17,830 13,693 -4,137 -23.2% 19
MA Savings vs. TM Spending AK 0.0 (MA Spending - TM Adj. Spending) / TM Adj. Spending PA GA -0.1 OH DE HI VA NH ID KY TN MI AR WI CT NM SC IN MS -0.2 KS ME RI UT LA -0.3 MO IL -0.4 -0.5 FL -0.6 500 600 700 800 900 1,000 1,100 TM Spending per enrollee-month 20
Categories of spending TM, unweighted TM, weighted MA Difference (3)-(2) ((3)-(2)) / (2) (1) (2) (3) (4) (5) No. of enrollee-months (000s) 154,082 154,082 22,609 Total spending 924 884 647 -237 -26.8% Inpatient 370 344 272 -72 -21.0% Outpatient 458 450 331 -119 -26.5% SNF 97 91 45 -45 -50.1% Hospice 31 33 24 -9 -27.7% 21
Geographic variation Corr (TM,MA) Coeff. Of Var (TM) Coeff. Of Var (MA) (1) (2) (3) Total spending 0.207 0.107 0.133 Outpatient spending -0.197 0.134 0.141 SNF spending 0.623 0.184 0.335 Inpatient spending 0.724 0.111 0.140 22
Utilization and Spending per encounter -70% -60% -50% -40% -30% -20% -10% 0% 10% 20% Total spending ($/month) -26.8% Inpatient days -22.8% Any inpatient admission Days cond'l on any -17.8% -6.1% SNF days -57.2% Days cond'l on any -55.8% Outpatient ED visits -16.5% Physician visits Any physician visits -18.1% -11.0% Number of visits cond'l on any -8.0% Spending per SNF day Spending per outpatient ED visit 2.0% 9.6% Inpatient: Spending per admission Spending per day Spending per AMI admission Spending per AMI day -0.5% 0.6% 1.8% -2.4% 23
Price differences for Major DRGs 5.0% Joint replacement 2.5% Stenting (MA-TM)/TM Average Renal failure w/ CC COPD w/ MCC Cardiac Cath COPD w/ CC 0.0% Pneumonia w/ CC COPD Arrhythmia Cardiac Cath Syncope and collapse Heart failure Heart failure & shock w/ MCC Chest pain Kidney & UTI G.I. bleed w/ CC Metabolic disorder Heart failure & shock w/ CC Digestive disorder Sepsis w MCC -2.5% -5.0% 3,000 5,000 7,000 9,000 11,000 13,000 Average DRG Payment Amount ($US) 24
Regional variation in inpatient prices 12% TN 8% PA ID AR FL GA 4% MS NH UT HI (MA-TM)/TM LA MO IN VA 0% KY KS WI IL NM SC OH -4% ME RI DE MI -8% CT -12% 8,000 9,000 10,000 TM Spending per enrollee-month 11,000 12,000 13,000 Slightly smaller coeff. of variation in prices across states in MA (0.063) vs. TM (0.077). 25
Investigating Potential Mechanisms for Savings Reducing low-value relative to high-value utilization Diagnostic tests and Imaging Preventive care Substituting less expensive care for more expensive care Use of post-acute care facilities Outpatient vs. inpatient surgery Primary vs. specialist care 26
Low value and High value care -60% -50% -40% -30% -20% -10% 0% 10% 20% 30% Total spending ($/month) -26.8% Diagnostic tests -26.6% Any diagnostic test -15.8% Cond'l on any -12.8% Imaging procedures -20.3% Any imaging test -11.3% Cond'l on any -10.1% Flu shot -38.0% Cardiovascular screen -18.4% Colorectal cancer screen -15.2% Mammogram 3.3% Pap smear 8.6% Prostate cancer screen -24.1% Hemoglobin A1c test -14.1% Blood lipids test -15.9% Eye exam -21.1% 27
Post-acute care -60% -50% -40% -30% -20% -10% 0% 10% 20% 30% Total spending ($/month) -26.8% Home -11.8% Home health service org. -21.0% SNF -36.6% Other post-acute care -57.3% Other (incl. hospice, death) -41.9% 28
Substitution to less expensive types of care -60% -50% -40% -30% -20% -10% 0% 10% 20% 30% Total spending ($/month) -26.8% Total surgeries 18.3% Outpatient surgeries 26.1% Inpatient surgeries -8.0% Primary care visits -6.3% Specialist visits -23.2% 29
Outline of Talk 1. 2. 3. 3. Background: Institutions and Data Levels of Spending and Utilization in MA and TM Selection vs. Treatment Selection vs. Treatment 30
Standard Treatment vs. Selection Individual Level Notation Individual Level Notation Individual treatment ??= 0 ?? or ??= 1 ?? ?? if ??= 0, or ??= ?? ?? if ??= 1 Individual cost ??= ?? ?? ?? ?? Individual treatment effect ?= ?? Decomposing Selection and Treatment Decomposing Selection and Treatment ?? ?? ??|??= 1 Treatment (on treated) effect: T = ? ?? ??|??= 0 ? ?? ??|??= 1 Selection effect: S = ? ?? ??|??= 0 ? ?? ??|??= 1 Observed cost difference: ? ?? Decomposition: Observed Cost Difference = ? + ? 31
Accounting for Selection: On observables Individual observables ?? Assumption: ?? Non-parametric reweighting strategy to account for observables Currently re-weighting TM on county and risk score Results don t change when we use a host of other observables and re0weight on county and propensity score ?? ??|?? TM Mean Total Spending (Reweighted) Reweight on Covariates Reweight nationally Reweight county- by-county (1) (2) (3) (4) None 924 924 Risk score -- 879 884 Prop. score county*risk score 886 887 Prop. score county*(age FE, female, HCC FE) 894 894 Prop. score county*(age FE, female, HCC FE, dual) 873 874 Prop. score county*dual*(age FE, female, HCC FE) 870 870 32
Selection on Unobservables Model of selection bias Model of selection bias Selection into MA: ??= ? ? ?,?,? 0 (Log) cost equation: ? ???|?,?,? = ???+ ??? + ? Cost under selection: ? ???|?,?,? = ???+ ??? + ? ?|?,?,? Problem if ? ?|?,?,? = 1 ? ?|?,?,? = 0 U Use se model of mortality to estimate model of mortality to estimate ? ?|?,?,? for No missing data on mortality! Two key assumptions: No MA treatment effect on (short run) mortality Same ? enters cost and mortality equations for ? = ?,? 33
Selection on Unobservables Recall: ? ???|?,?,? = ???+ ??? + ? ?|?,?,? Practical Approach: Mortality: exp ???+ ??? + ? 1 + exp ???+ ??? + ? ? ?|?,?,? = Derive log-odds ratio: ? ?|?,?,? 1 ? ?|?,?,? ? ?,?,? = ln = ???+ ??? + ? Log-Odd under selection: E ?|?,?,? = ???+ ??? + E ?|?,?,? We can now estimate ? ?|?,?,? for ? = 0,1 34
Selection on unobservables Results: About 23% of observed log cost difference due to selection, remaining 77% of the difference due to treatment Alternatively: Can apply similar idea in the context of the propensity score and find about half of spending difference due to selection: TM Mean Total Spending (Reweighted) Reweight on Covariates Reweight nationally Reweight county- by-county (1) (2) (3) (4) None 924 924 Risk score -- 879 884 Predicted mortality 746 744 Prop. score county*predicted mortality 748 747 35
Conclusion Rare opportunity for side by side comparison of public and private health insurance systems operating on similar scale, for same population, in same markets with same providers Main findings: Healthcare spending for enrollees in MA is 27% less than for enrollees of same risk score and county in TM 25-50 percent of this difference may reflect selection and upcoding Spending differences driven by utilization; prices are very similar Some channels for saving are different use of post-acute care and substitution to less expensive care (primary care for specialist, outpatient surgery for inpatient) Geographic variation in spending slighter higher in MA than TM Questions for further study Implications for consumers and insurers Impact of competition 36
Mortality vs. Spending in TM and MA 0.060 0.045 OH PA IL OH 0.055 0.040 LA RI KY MS TN PA WI MO SC MI AR MA annual mortality rate TM annual mortality rate IN KS MS CT KS FL RI 0.050 0.035 GA ME UT DE MO VA MI FL KYLA AR TN ID IL SC VA IN GA WI NH NM 0.045 0.030 UT DE ID HI NM NH 0.040 0.025 AK HI ME CT AK 0.035 0.020 600 650 700 750 800 850 900 950 1,000 1,050 1,100 500 550 600 650 700 750 800 850 TM Spending per enrollee-month MA Spending per enrollee-month 38
Utilization Differences TM, unweighted TM, weighted MA Difference (3)-(2) ((3)-(2)) / (2) (1) (2) (3) (4) (5) Total spending ($/month) 924 884 647 -237 -26.8% Panel A. Utilization measures (per enrollee-month) Inpatient days Any inpatient admission Days cond'l on any 0.203 0.027 7.44 0.187 0.025 7.41 0.145 0.021 6.96 -0.043 -0.0045 -0.45 -22.8% -17.8% -6.1% SNF days Days cond'l on any 0.336 47.4 0.308 46.8 0.132 20.7 -0.176 -26.1 -57.2% -55.8% Outpatient ED visits 0.030 0.027 0.023 -0.005 -16.5% Physician visits Any physician visits Number of visits cond'l on any 1.24 0.549 2.25 1.24 0.548 2.27 1.02 0.488 2.09 -0.22 -0.060 -0.18 -18.1% -11.0% -8.0% 39
Spending per use TM, unweighted TM, weighted MA Difference (3)-(2) ((3)-(2)) / (2) (1) (2) (3) (4) (5) Total spending ($/month) 924 884 647 -237 -26.8% Panel B. Spending per encounter ($) Spending per SNF day Spending per outpatient ED visit 377 783 376 773 384 846 8 2.0% 9.6% 74 Inpatient: Spending per admission Spending per day Spending per AMI admission Spending per AMI day 10,223 1,906 14,619 2,725 10,201 1,900 14,580 2,726 10,148 1,912 14,845 2,661 -53 12 266 -65 -0.5% 0.6% 1.8% -2.4% 40
DRG prices DRG Code DRG Description MA Admissions MA price TM price (MA-TM)/TM (1) (2) (3) (4) (5) (6) ------ All DRGs (weighted by MA admission shares) ------ 437,714 10,085 9,927 1.6% 470 392 871 291 292 312 690 194 310 313 247 190 378 287 641 193 683 192 191 293 Major Joint Replacement Or Reattachment Of Lower Extremity W/O Mcc Esophagitis, Gastroent & Misc Digest Disorders W/O Mcc Septicemia Or Severe Sepsis W/O Mv 96+ Hours W Mcc Heart Failure & Shock W Mcc Heart Failure & Shock W Cc Syncope & Collapse Kidney & Urinary Tract Infections W/O Mcc Simple Pneumonia & Pleurisy W Cc Cardiac Arrhythmia & Conduction Disorders W/O Cc/Mcc Chest Pain Perc Cardiovasc Proc W Drug-Eluting Stent W/O Mcc Chronic Obstructive Pulmonary Disease W Mcc G.I. Hemorrhage W Cc Circulatory Disorders Except Ami, W Card Cath W/O Mcc Nutritional & Misc Metabolic Disorders W/O Mcc Simple Pneumonia & Pleurisy W Mcc Renal Failure W Cc Chronic Obstructive Pulmonary Disease W/O Cc/Mcc Chronic Obstructive Pulmonary Disease W Cc Heart Failure & Shock W/O Cc/Mcc 21,077 9,899 9,153 8,708 8,222 7,467 7,177 6,606 6,545 6,175 5,985 5,919 5,691 5,655 5,511 5,076 4,869 4,847 4,771 4,621 12,440 4,227 11,268 8,956 5,976 4,452 4,695 6,031 3,478 3,352 11,771 7,277 6,011 6,358 4,194 8,706 6,487 4,354 5,855 4,254 11,958 4,312 11,532 9,024 6,073 4,478 4,730 6,039 3,497 3,379 11,482 7,260 6,096 6,376 4,250 8,693 6,415 4,377 5,847 4,285 4.0% -2.0% -2.3% -0.7% -1.6% -0.6% -0.7% -0.1% -0.6% -0.8% 2.5% 0.2% -1.4% -0.3% -1.3% 0.1% 1.1% -0.5% 0.1% -0.7% 41
State-level prices State MA Admissions MA price TM price (MA-TM)/TM (1) (2) (3) (4) (5) AR CT DE FL GA HI ID IL IN KS KY LA ME MI MO MS NH NM OH PA RI SC TN UT VA WI 4,338 2,886 772 103,324 27,154 1,339 2,079 18,480 11,649 5,079 12,883 20,502 932 8,485 16,814 3,865 538 1,560 87,631 34,338 5,116 6,663 23,664 5,813 13,167 18,609 9,420 11,497 10,794 10,291 10,299 13,279 10,305 10,182 9,700 9,421 9,677 9,947 10,340 10,096 9,631 9,716 10,856 10,863 9,562 11,169 11,571 10,007 9,755 9,589 9,787 10,345 9,011 12,771 11,470 9,830 9,892 13,176 9,757 10,333 9,542 9,490 9,688 9,834 10,736 10,943 9,541 9,458 10,692 11,187 9,871 10,403 12,067 10,283 8,909 9,319 9,885 10,488 4.5% -10.0% -5.9% 4.7% 4.1% 0.8% 5.6% -1.5% 1.6% -0.7% -0.1% 1.2% -3.7% -7.7% 0.9% 2.7% 1.5% -2.9% -3.1% 7.4% -4.1% -2.7% 9.5% 2.9% -1.0% -1.4% 42
Diagnostic and imaging TM, unweighted TM, weighted MA Difference (3)-(2) ((3)-(2)) / (2) (1) (2) (3) (4) (5) A. Testing and imaging: Diagnostic tests Any diagnostic test Cond'l on any 2.14 0.356 6.00 2.10 0.347 6.05 1.54 0.293 5.28 -0.56 -0.055 -0.77 -26.6% -15.8% -12.8% Imaging procedures Any imaging test Cond'l on any 0.67 0.177 3.76 0.65 0.175 3.73 0.52 0.155 3.35 -0.13 -0.020 -0.38 -20.3% -11.3% -10.1% 43
Preventive care TM, unweighted TM, weighted MA Difference (3)-(2) ((3)-(2)) / (2) (1) (2) (3) (4) (5) B. Preventive care (rates per relevant population): Flu shot Cardiovascular screen Colorectal cancer screen Mammogram Pap smear Prostate cancer screen Hemoglobin A1c test Blood lipids test Eye exam 0.051 0.092 0.010 0.046 0.012 0.024 0.065 0.105 0.068 0.050 0.095 0.010 0.046 0.012 0.023 0.064 0.108 0.068 0.031 0.077 0.009 0.047 0.013 0.018 0.055 0.091 0.054 -0.019 -0.017 -0.002 0.002 0.001 -0.006 -0.009 -0.017 -0.014 -38.0% -18.4% -15.2% 3.3% 8.6% -24.1% -14.1% -15.9% -21.1% 44
Discharge patterns TM, unweighted TM, weighted MA Difference (3)-(2) ((3)-(2)) / (2) (1) (2) (3) (4) (5) A. Hospital discharge destinations: Home Home health service org. SNF Other post-acute care Other (incl. hospice, death) 0.0125 0.0048 0.0060 0.0009 0.0031 0.0123 0.0049 0.0062 0.0009 0.0030 0.0109 0.0039 0.0039 0.0004 0.0018 -0.0014 -0.0010 -0.0023 -0.0005 -0.0013 -11.8% -21.0% -36.6% -57.3% -41.9% 45
Hospital discharges (in shares) TM, unweighted TM, weighted MA Difference (3)-(2) ((3)-(2)) / (2) (1) (2) (3) (4) (5) A. Hospital discharge destinations: Home Home health service org. SNF Other post-acute care Other (incl. hospice, death) 0.457 0.175 0.221 0.033 0.114 0.451 0.179 0.226 0.033 0.111 0.522 0.186 0.189 0.018 0.085 0.072 0.007 -0.038 -0.014 -0.026 15.9% 3.7% -16.7% -43.9% -23.7% 46
Surgeries and specialists TM, unweighted TM, weighted MA Difference (3)-(2) ((3)-(2)) / (2) (1) (2) (3) (4) (5) C. Surgeries and specialists: Any surgery Outpatient surgeriesb Inpatient surgeriesc 0.036 0.028 0.008 0.033 0.025 0.008 0.039 0.032 0.007 0.006 0.007 -0.001 18.3% 26.1% -8.0% Primary care visits Specialist visits 0.381 0.855 0.376 0.866 0.352 0.665 -0.024 -0.201 -6.3% -23.2% 47
Propensity score distributions TM MA 0 0.1 0.2 0.3 0.4 0.5 0.6 0.7 0.8 0.9 1 Propensity score 48


