Higher Level Math Concepts Explained
Explore key concepts in distance-time graphs, straight line graphs, coordinate geometry, types of graphs, and quadratic graphs. Learn about calculating speed, equations of lines, midpoint, distances, and identifying different graph types.

Download Presentation

Please find below an Image/Link to download the presentation.
The content on the website is provided AS IS for your information and personal use only. It may not be sold, licensed, or shared on other websites without obtaining consent from the author. If you encounter any issues during the download, it is possible that the publisher has removed the file from their server.
You are allowed to download the files provided on this website for personal or commercial use, subject to the condition that they are used lawfully. All files are the property of their respective owners.
The content on the website is provided AS IS for your information and personal use only. It may not be sold, licensed, or shared on other websites without obtaining consent from the author.
E N D
Presentation Transcript
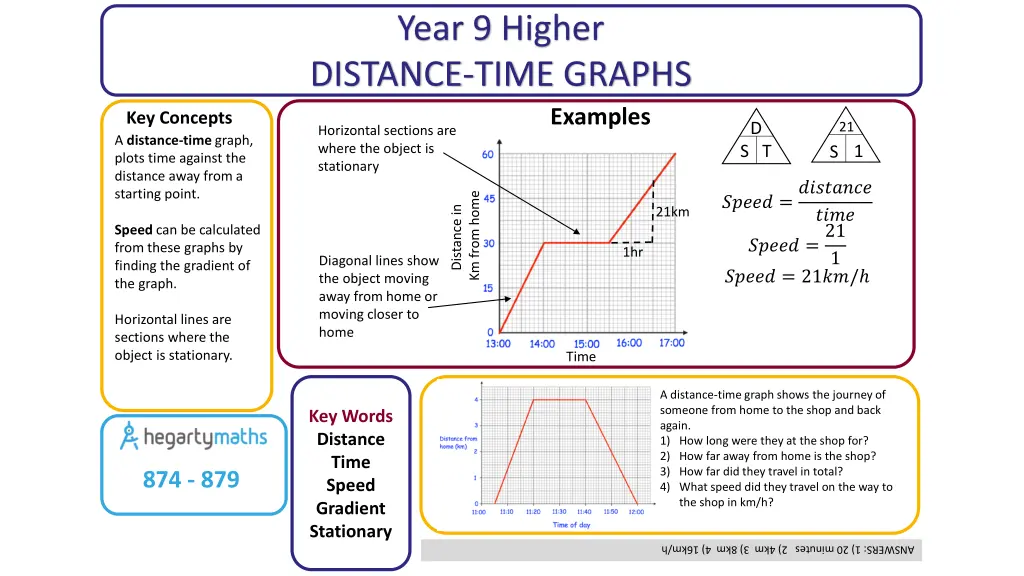
Year 9 Higher DISTANCE-TIME GRAPHS Examples Key Concepts A distance-time graph, plots time against the distance away from a starting point. D 21 Horizontal sections are where the object is stationary 1 S T S ????? =???????? ????? =21 Km from home Distance in 21km ???? Speed can be calculated from these graphs by finding the gradient of the graph. 1hr 1 Diagonal lines show the object moving away from home or moving closer to home ????? = 21??/ Horizontal lines are sections where the object is stationary. Time A distance-time graph shows the journey of someone from home to the shop and back again. 1) How long were they at the shop for? 2) How far away from home is the shop? 3) How far did they travel in total? 4) What speed did they travel on the way to the shop in km/h? Key Words Distance Time Speed Gradient Stationary 874 - 879 ANSWERS: 1) 20 minutes 2) 4km 3) 8km 4) 16km/h
Year 9 Higher STRAIGHT LINE GRAPHS AND EQUATION OF A LINE Plot the graph of ? = ? + 1 Examples Key Concepts Calculate the equation of this line: x 0 1 2 Coordinates in 2D are written as follows: ? = ?? + ? ? =4 2 = 2 ? = 2? + ? y 1 2 3 y x is the value that is to the left/right Straight line graphs always have the equation: ? = ?? + ? m is the gradient i.e. the steepness of the graph. c is the y intercept i.e. where the graph cuts the y axis. y is the value that is to up/down ?,? x x 4 x x Substitute in a coordinate: (2,7) 2 7 = (2 2) + ? 3 = ? ? = 2? + 3 1) Plot the line ? = 3? 2 Key Words Coordinate Gradient 199,200,205,207- 211,214 2) Find the equation of the line for the attached graph. ANSWERS: 2) ? = 2? + 4
Year 9 Higher COORDINATE GEOMETRY Examples Key Concepts ? = ? x Calculate the midpoint between the coordinates (1,1) and (3,4). 3 + 1 2 ,1 + 4 2 3 ???????? = = 2,2,5 ? = 1 ? = 2 Calculate the distance between the coordinates (1,1) and (3,4). ????? = = 3.61 x 2 Parallel lines have the same gradient. e.g. ? = 2? + 3 ??? ? = 2? 1 Perpendicular line gradients are the negative reciprocal of one another e.g. ? = 2? ??? ? = 1 22+ 32 2? 1) Calculate the midpoint between the coordinates (2,7) and (9,11). 2) Calculate the distance between the coordinates (2,7) and (9,11). Key Words Parallel Perpendicular Gradient Midpoint Length 200, 205, 208 ANSWERS: 1) (5.5, 9) 2) 8.06
Year 9 Higher TYPES OF GRAPH Examples Reciprocal graphs ? =1 Circle graphs ?2+ ?2= 4 Quadratic graphs ? = ?2 Cubic graphs ? = ?3 ? ?2+ ?2= 6 ? = ? ? = ?3 2 ? = ?2+ 1 Match the graph with the correct equation: b) Key Words Quadratic Cubic Reciprocal Circle Graph 1) 2) 3) 4) 1 d) a) 257, 298-301, 314 c) ANSWERS: 1d 2b 3a 4c
Year 9 Higher QUADRATIC GRAPHS Line of symmetry ? = 1 Examples ? = ?2+ 2? 8 Key Concepts A quadratic graph will always be in the shape of a parabola. ? = ?2 A quadratic equation can be solved from its graph. The roots of the graph tell us the possible solutions for the equation. There can be 1 root, 2 roots or no roots for a quadratic equation. This is dependant on how many times the graph crosses the x axis. ? = ?2 The roots of a quadratic graph are where the graph crosses the x axis. The roots are the solutions to the equation. Roots ? = 4 ? = 2 y intercept = 8 Turning point ( 1, 9) Key Words Quadratic Roots Intercept Turning point Line of symmetry Identify from the graph of ? = ?2+ 4? + 3: 1) The line of symmetry 2) The turning point 3) The y intercept 4) The two roots of the equation 251-256 ANSWERS 1) ? = 2 2) ( 2, 1) 3) 3 4) ? = 1 ??? ? = 3
Year 9 Higher SOLVE QUADRATIC INEQUALITIES GRAPHICALLY Key Concepts When an quadratic inequality is solved it provides the range of values that are possible. Examples When an equation has solutions greater than 0 then the solutions are taken from above the x axis. When an equation has solutions less than 0 then the solutions are taken from below the x axis. ?2+ 2? 1 0 The range of solutions are: ?2+ 2? 1 0 The range of solutions are: ? 0.5 ??? ? 2.5 2.5 ? 0.5 2) 1) State the range of values possible for each inequality. Key Words Quadratic Inequality Solutions 277 ?2+ 3? + 2 0 ?2 ? 2 0 ANSWERS 1) ? 1 ??? ? 2 2) 2 ? 1
Year 9 Higher INEQUALITIES AND REGIONS ON GRAPHS Examples Key Concepts Highlight the region that represents the possible solutions to the following inequalities: ? 2 ? 2? ? + ? 3 Plot the points for each linear graph and draw the lines. Choose a coordinate whose values can be substituted in to each inequality. If the inequality is FALSE once values have been substituted in, then shade this area. You should be left with one area with no shading once you have repeated this for all inequalities. Each x is a possible set of integer values which are true for all three inequalities. Eg. (2,1), (2,2) (2,3) Inequalities can be represented on graphs. They highlight regions where all of the possible true values exist within its given constraints. Solid lines are used on the graph when are involved. Dashed lines are used on the graph when <> are involved. ? ? + 2 State the possible integer values that are true for the given inequalities. Key Words Region Inequality Solution 273-276 ? ? + 1 ? 1 ANSWER (1,0), (1,1), (1,2), (1,3), (0,1), (0,2)