Histogram Collections and Distribution Comparisons
Explore various histograms depicting different distributions such as quiz scores and grades, along with comparisons of heart attack patient ages between genders. Analyze center, shape, spread, and unusual features in each distribution to understand the data patterns.

Download Presentation

Please find below an Image/Link to download the presentation.
The content on the website is provided AS IS for your information and personal use only. It may not be sold, licensed, or shared on other websites without obtaining consent from the author. If you encounter any issues during the download, it is possible that the publisher has removed the file from their server.
You are allowed to download the files provided on this website for personal or commercial use, subject to the condition that they are used lawfully. All files are the property of their respective owners.
The content on the website is provided AS IS for your information and personal use only. It may not be sold, licensed, or shared on other websites without obtaining consent from the author.
E N D
Presentation Transcript
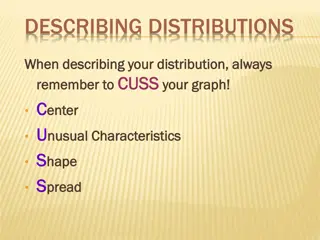
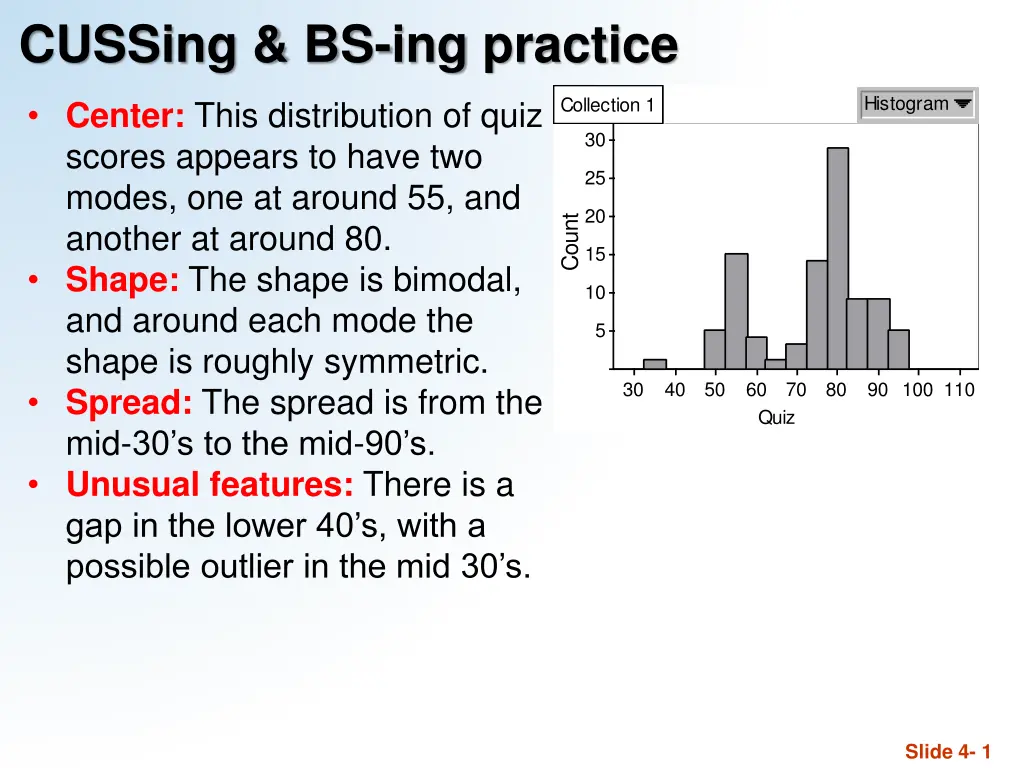
CUSSing & BS-ing practice Histogram Collection 1 Center: This distribution of quiz scores appears to have two modes, one at around 55, and another at around 80. Shape: The shape is bimodal, and around each mode the shape is roughly symmetric. Spread: The spread is from the mid-30 s to the mid-90 s. Unusual features: There is a gap in the lower 40 s, with a possible outlier in the mid 30 s. 30 25 20 Count 15 10 5 30 40 50 60 70 80 90 100 110 Quiz Slide 4- 1
more CUSSing & BS-ing Center: This distribution of grades has a single mode at around 100. Shape: The shape is unimodal and skewed to the left (to the lower grades) Spread: The spread is from the mid-50 s to about 100. Unusual features: There is a gap from the upper 50 s to the upper 60 s, with a possible outlier in the mid 50 s. Histogram Collection 1 30 25 20 Count 15 10 5 60 70 80 90 100 Grades this does NOT mean that someone had a grade of above 100. (more likely, a lot of 98 s and/or 99 s) Slide 4- 2
Comparing Distributions Compare the following distributions of ages for female and male heart attack patients. Slide 4- 3
Comparing Distributions Be sure to use language of comparison. Center: This distribution of ages for females has a higher center (at around 78) than the distribution for male patients (around 62). Shape: Both distributions are unimodal. The distribution for males is nearly symmetric, while the distribution for females is slightly skewed to the lower ages. Slide 4- 4
Comparing Distributions Spread: Both distributions have similar spreads: females from around 30 100, and males from about 24 96. Overall, the distribution for female ages is slightly higher than that for male ages. (There are no unusual features) YOU MUST USE COMPLETE SENTENCES!!! Slide 4- 5
Describe and Compare CENTER describe the peaks (modes). Compare them (which is higher/lower) and give specific numerical values. SHAPE How many modes? Roughly symmetric or skewed? (never use the word symmetric without the word roughly ) SPREAD How far do the distributions spread out? Is one more spread out than the other? Give specific numerical values. UNUSUAL FEATURES Gaps? Outliers?