Historic Battery Capacity Analysis Report
This report analyzes the historic capacity contribution of various batteries installed from 2013 to 2019. It includes details on installed capacity, duration, and capacity contribution over peak load hours in 2020. The analysis also highlights the percent responsibility of each unit in meeting peak load demands.

Download Presentation

Please find below an Image/Link to download the presentation.
The content on the website is provided AS IS for your information and personal use only. It may not be sold, licensed, or shared on other websites without obtaining consent from the author. If you encounter any issues during the download, it is possible that the publisher has removed the file from their server.
You are allowed to download the files provided on this website for personal or commercial use, subject to the condition that they are used lawfully. All files are the property of their respective owners.
The content on the website is provided AS IS for your information and personal use only. It may not be sold, licensed, or shared on other websites without obtaining consent from the author.
E N D
Presentation Transcript
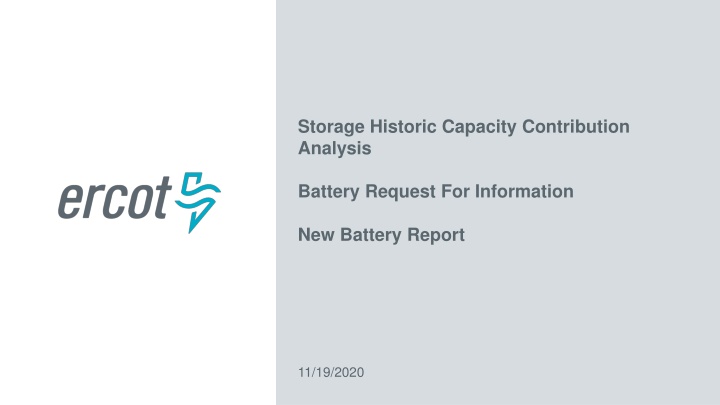
Storage Historic Capacity Contribution Analysis Battery Request For Information New Battery Report 11/19/2020
Installed Capacity and Duration of the Batteries Included in Analysis Resource Name Unit Code Installed Capacity, MW Duration*, Hours Operation Start Notrees Battery Facility NWF_NBS 36 0.4 1/21/2013 OCI Alamo 1 OCI_ALM1_ASTRO1 1 0.3 1/27/2016 TOS Battery Storage TOSBATT_UNIT1 2 N/A 3/31/2017 0.4 8/11/2017 Blue Summit Battery BLSUMMIT_BATTERY 30 1 1/3/2018 Inadale ESS INDL_ESS 9.9 Pyron ESS PYR_ESS 9.9 1 1/4/2018 Castle Gap Battery CASL_GAP_BATTERY1 9.9 4.2 12/31/2018 Rabbit Hill ESS RHESS2_ESS_1 9.9 N/A 7/1/2019 West Columbia Storage WCOLLDG_BSS_U1 9.9 N/A 8/2/2019 Worsham Battery WRSBES_BESS1 9.9 N/A 8/28/2019 Flat Top Battery FLTBES_BESS1 9.9 N/A 9/1/2019 Port Lavaca PTLBES_BESS1 9.9 N/A 11/15/2019 * Duration is calculated based on Nameplate Capacity MW and Nameplate Energy Capacity MWh in Form EIA-860 2019 2 PUBLIC
Capacity Contribution over 20 Peak Load Hours, 2020 Unit 1 Unit 2 Unit 3 Unit 4 Unit 5 Unit 6 Unit 7 Unit 8 Unit 9 Unit 10 Unit 11 Unit 12 Load 73,668 74,225 74,311 74,001 73,699 74,046 74,072 73,706 73,625 74,153 74,328 74,053 74,008 74,294 74,091 73,808 73,503 73,770 74,323 74,113 13-Jul-20 15:00 13-Jul-20 16:00 13-Jul-20 17:00 13-Jul-20 18:00 16-Jul-20 17:00 12-Aug-20 16:00 12-Aug-20 17:00 12-Aug-20 18:00 13-Aug-20 15:00 13-Aug-20 16:00 13-Aug-20 17:00 13-Aug-20 18:00 14-Aug-20 16:00 14-Aug-20 17:00 14-Aug-20 18:00 15-Aug-20 18:00 16-Aug-20 18:00 28-Aug-20 15:00 28-Aug-20 16:00 28-Aug-20 17:00 Avg. Contribution 6% 19% 8% 9% 13% 6% 0% 14% 11% 9% 3% 3% 3% 0% 16% 14% 8% 10% 0% 3% 8% 3% 0% 0% 0% 10% 6% 6% 12% 11% 7% 8% 3% 3% 0% 15% 16% 8% 10% 0% 2% 6% 3% 10% 4% 5% 7% 3% 2% 7% 6% 5% 4% 2% 2% 0% 8% 8% 4% 8% 0% 2% 4% 4% 4% 1% 13% 10% 9% 6% 12% 11% 7% 8% 3% 6% 4% 15% 16% 8% 10% 0% 3% 8% 3% 12% 5% 6% 8% 6% 0% 13% 10% 8% 8% 3% 3% 0% 15% 13% 7% 4% 0% 2% 6% 7% 14% 9% 10% 14% 5% 1% 11% 9% 5% 1% 3% 3% 0% 12% 7% 7% 3% 0% 4% 6% 0% 50% 83% 54% 0% 49% 0% 0% 99% 100% 100% 0% 100% 67% 0% 0% 8% 97% 93% 53% 48% 0% 1% 1% 0% 0% 0% 1% 0% 0% 0% 1% 0% 3% 8% 0% 3% 1% 0% 0% 1% 1% 0% 1% 1% 0% 0% 0% 0% 1% 0% 0% 1% 1% 0% 0% 1% 1% 1% 1% 0% 1% 1% 1% 3% 1% 1% 1% 1% 1% 2% 1% 0% 3% 2% 20% 6% 2% 3% 1% 2% 1% 2% 3% 0% 1% 1% 0% 0% 0% 0% 0% 0% 0% 1% 0% 0% 0% 1% 1% 1% 1% 0% 1% 1% 0% 1% 0% 0% 0% 7% 3% 1% 1% 0% 1% 1% 0% 0% 1% 0% 0% 16% 25% 16% 4% *Green color correspond to the lowest contribution, while red corresponds to the highest 3 PUBLIC
AS Responsibility as Percentage of Capacity over 20 Peak Load Hours, 2020 Unit 1 Unit 2 Unit 3 Unit 4 Unit 5 Unit 6 Unit 8 Unit 9 Unit 10 Unit 11 Unit 12 Avg. FRRS 92% 92% 92% 92% 92% 93% 92% 92% 92% 92% 92% 92% 92% 92% 92% 93% 92% 93% 93% 93% 93% Avg. FRRS 92% 92% 92% 92% 92% 92% 92% 92% 91% 92% 92% 92% 92% 92% 92% 93% 92% 92% 93% 93% 92% Avg. FRRS 47% 47% 47% 47% 47% 47% 47% 47% 49% 47% 47% 47% 47% 47% 47% 47% 47% 49% 47% 47% 47% Avg. FRRS 100% 100% 100% 100% 92% 92% 92% 92% 91% 92% 92% 92% 92% 92% 92% 93% 92% 92% 93% 93% 94% Avg. FRRS 60% 60% 60% 60% 60% 90% 90% 90% 90% 90% 90% 90% 90% 90% 90% 90% 90% 50% 50% 50% 77% Avg. FRRS 100% 100% 100% 100% 90% 70% 70% 70% 70% 70% 70% 70% 70% 70% 70% 45% 70% 75% 75% 75% 77% Avg. RRS 75% 75% 75% 75% 100% 100% 100% 100% 100% 100% 100% 100% 77% 75% 75% 75% 100% 75% 75% 75% 86% Avg. RRS 98% 98% 98% 98% 98% 98% 98% 98% 98% 98% 98% 98% 98% 98% 98% 98% 98% 98% 98% 98% 98% Avg. RRS 100% 100% 100% 100% 90% 100% 100% 100% 100% 100% 100% 100% 0% 0% 0% 100% 100% 100% 100% 100% 84% Avg. RRS 48% 48% 48% 48% 75% 100% 100% 100% 100% 100% 100% 100% 100% 100% 100% 100% 74% 100% 100% 100% 87% Avg. RRS 49% 49% 49% 49% 98% 73% 73% 73% 73% 73% 73% 73% 98% 98% 98% 98% 99% 49% 49% 49% 72% 13-Jul-20 15:00 13-Jul-20 16:00 13-Jul-20 17:00 13-Jul-20 18:00 16-Jul-20 17:00 12-Aug-20 16:00 12-Aug-20 17:00 12-Aug-20 18:00 13-Aug-20 15:00 13-Aug-20 16:00 13-Aug-20 17:00 13-Aug-20 18:00 14-Aug-20 16:00 14-Aug-20 17:00 14-Aug-20 18:00 15-Aug-20 18:00 16-Aug-20 18:00 28-Aug-20 15:00 28-Aug-20 16:00 28-Aug-20 17:00 Average 4 PUBLIC
Capacity Contribution as a Function of SPP (over 20 peak load hours), 2020 5 PUBLIC
Capacity Contribution over 20 Peak Load Hours, 2019 Unit 1 Unit 2 Unit 3 Unit 4 Unit 5 Unit 6 Unit 7 Load 07-Aug-19 16:00 07-Aug-19 17:00 09-Aug-19 15:00 09-Aug-19 16:00 12-Aug-19 14:00 12-Aug-19 15:00 12-Aug-19 16:00 12-Aug-19 17:00 12-Aug-19 18:00 13-Aug-19 14:00 13-Aug-19 15:00 13-Aug-19 16:00 13-Aug-19 17:00 19-Aug-19 15:00 19-Aug-19 16:00 19-Aug-19 17:00 26-Aug-19 15:00 26-Aug-19 16:00 26-Aug-19 17:00 26-Aug-19 18:00 Average Contribution 73,150 72,928 72,948 73,143 73,313 74,330 74,666 74,525 73,635 73,455 74,302 74,293 74,059 73,794 73,871 73,382 73,947 74,433 74,264 73,213 8% 0% 8% 11% 9% 0% 9% 0% 6% 7% 9% 3% 3% 5% 11% 9% 5% 0% 3% 7% 6% 7% 0% 7% 9% 7% 3% 8% 3% 9% 7% 9% 3% 0% 3% 8% 9% 1% 3% 3% 5% 5% 3% 0% 3% 4% 0% 0% 0% 0% 0% 0% 0% 0% 0% 0% 0% 0% 6% 0% 2% 2% 1% 7% 0% 7% 9% 7% 3% 8% 3% 6% 7% 9% 3% 0% 3% 8% 9% 1% 3% 3% 4% 5% 8% 0% 7% 11% 6% 3% 8% 0% 6% 7% 9% 3% 0% 5% 11% 9% 0% 0% 0% 5% 5% 10% 0% 9% 14% 0% 0% 0% 0% 0% 1% 0% 1% 0% 0% 0% 0% 9% 0% 3% 0% 2% 71% 0% 83% 15% 90% 83% 74% 33% 0% 100% 100% 87% 5% 47% 8% 0% 0% 0% 0% 0% 40% 6 PUBLIC
AS Responsibility as Percentage of Capacity over 20 Peak Load Hours, 2019 Unit 1 Unit 2 Unit 3 Unit 4 Unit 5 Unit 6 Avg. FRRS 100% 100% 100% 100% 100% 100% 100% 100% 100% 100% 100% 100% 100% 100% 100% 100% 79% 79% 79% 100% 97% Avg. FRRS 100% 100% 100% 100% 100% 100% 100% 100% 100% 100% 100% 100% 100% 100% 100% 100% 80% 80% 80% 98% 97% Avg. FRRS 36% 36% 36% 36% 42% 42% 42% 42% 42% 42% 42% 42% 42% 42% 42% 42% 67% 67% 67% 44% 44% Avg. FRRS 100% 100% 100% 100% 100% 100% 100% 100% 100% 100% 100% 100% 100% 100% 100% 100% 0% 0% 0% 100% 85% Avg. FRRS 100% 100% 100% 100% 100% 100% 100% 100% 100% 100% 100% 100% 100% 100% 100% 100% 80% 80% 80% 98% 97% Avg. FRRS 100% 100% 100% 100% 0% 0% 0% 0% 0% 0% 0% 0% 0% 0% 0% 0% 100% 80% 80% 0% 33% 07-Aug-19 16:00 07-Aug-19 17:00 09-Aug-19 15:00 09-Aug-19 16:00 12-Aug-19 14:00 12-Aug-19 15:00 12-Aug-19 16:00 12-Aug-19 17:00 12-Aug-19 18:00 13-Aug-19 14:00 13-Aug-19 15:00 13-Aug-19 16:00 13-Aug-19 17:00 19-Aug-19 15:00 19-Aug-19 16:00 19-Aug-19 17:00 26-Aug-19 15:00 26-Aug-19 16:00 26-Aug-19 17:00 26-Aug-19 18:00 Average 7 PUBLIC
Capacity Contribution as a Function of SPP (over 20 peak load hours), 2019 8 PUBLIC
Conclusions / Recommendations Historically only providing AS? Status Duration Capacity contribution (%) Operational <4 hours Yes 0% Operational <4 hours No % based on historic performance % based on historic average AS responsibility Operational 4+ hours Yes Operational 4+ hours No % based on historic performance Planned <4 hours N/A 0% Use same % as operational 4+ hour batteries providing energy Planned 4+ hours N/A 9 PUBLIC
Request for Information ERCOT does not have information on roundtrip efficiency, energy capacity MWh or if a battery is a part of Self- Limiting Facility (NPRR1026) or DC- Coupled Resource (NPRR1029) Until approval of RRGRR023 and its implementation and in RIOO, ERCOT plans to collect this information via RFI For planned projects, RFI data submission form to be submitted via RIOO-IS as an Excel file upload once an IA is signed ERCOT will also send the RFI to REs with existing operational batteries 10 PUBLIC
Reporting of DC-Coupled and Self-Limiting Facilities in GIS NPRR1026, PGRR081, NPRR1029 and RRGRR023 related to Self-Limiting Resources, Self-Limiting Facilities and DC-Coupled Resources are currently at TAC for consideration. RIOO currently does not have capability to explicitly capture Self-Limiting Facilities, Self-Limiting Resources or DC-Coupled Resources and their MW limits during the registration process. Until approval and implementation of RRGRR023 in RIOO, ERCOT will use an approach similar to re-powers to track DC-Coupled Resources, Self-Limiting Resource and Facilities MW limit. 11 PUBLIC
Reporting of Self-Limiting Facilities in GIS, Based on RI Proposal To aid the GIS Report, a standard naming convention will be used for proposed Self-Limiting Facilities: [Common Name][space][ Solar or Storage ][space][ SLF ] For Self-Limiting Facilities, whose total MW rating is equal to the rating of the non-battery resource (e.g. PVGR, WGR, etc.): The non-battery resource s ratings in RIOO will be its true Maximum MW and Maximum Summer/Winter MW. The battery s Maximum MW in RIOO will be its true rating, while Maximum Summer/Winter MW set to 0. For Self-Limiting Facilities whose MW rating is higher than the rating of the non-battery resource: The non-battery resource s ratings in RIOO will be its true Maximum MW and Maximum Summer/Winter MW. The battery s Maximum MW in RIOO will be its true capacity, while Maximum Summer/Winter MW will be non-zero to reflect the MW needed to meet the intended Self-Limit. Same approach will be used for DC-Coupled Resources. GIS Report logic that handles re-powers uses both Maximum MW and Maximum Winter MW and thus will capture MW limit of Self-Limiting Resources, Self-Limiting Facilities and DC-Coupled Resources. 12 PUBLIC
New Report on Batteries as a Supplement to GIS As of October GIS there are 123 battery projects totaling 16,178 MW of capacity in the interconnection queue for which FIS has been requested. These are reported in detail in the GIS Project Details tab. ERCOT has been asked to report on standalone batteries vs. batteries co-located with other Resources such as Solar, Wind, etc. Currently there is nothing in RIOO that allows ERCOT to explicitly identify battery projects co- located with projects of a different resource type. ERCOT currently manually identifies projects as co-located, if the projects have the same POI, the same IE or same parent company, and a similar name, e.g. XYZ Storage and XYZ Solar. 13 PUBLIC
New Report on Batteries as a Supplement to GIS Project Type Number of Storage Projects MW of Storage % of Total Storage MW Starting from November 2020 ERCOT publishes a battery report : RPT.00015933.0000000000000000.Co- located_Battery_Identification_Report_Month_Ye ar.xlsx. The report parses battery projects from the Project Details tab of the GIS report into standalone, co-located with planned or operational Solar, Wind, or Thermal Resources. Standalone batteries are listed in one tab. If a battery is co-located with another Resource the report shows that Resource s information as well on the respective tab. The Report also includes a Summary and Historic GIS Trend Stand-Alone Batery Energy Storage Batery Energy Storage+Solar Batery Energy Storage+Wind Batery Energy Storage+Other Tech Total (with FIS Requested) 74 41 5 3 123 10,264 5,088 363 464 16,178 63% 31% 2% 3% 100% 14 PUBLIC
Thank you! Questions? Julia Matevosyan Julia.Matevosyan@ercot.com 15 PUBLIC


![❤[PDF]⚡ Apollo Mission Control: The Making of a National Historic Landmark (Spr](/thumb/21551/pdf-apollo-mission-control-the-making-of-a-national-historic-landmark-spr.jpg)