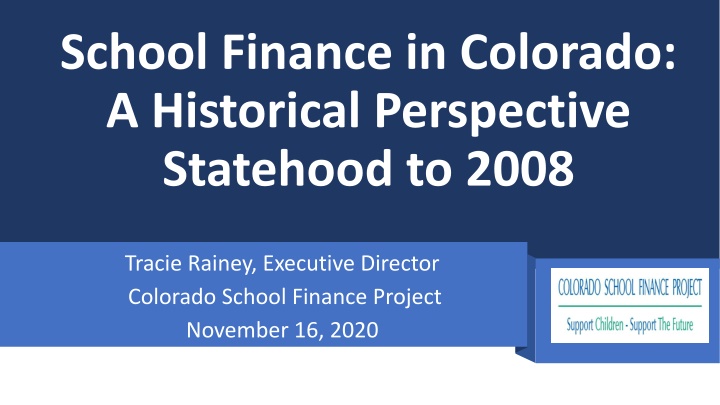
Historical Perspective of School Finance in Colorado since Statehood
Explore the historical evolution of school finance in Colorado from statehood to 2008, examining changes in population, demographics, funding, legal impacts, and the influence of court decisions and ballot measures. Gain insights into the current funding formula and student demographics shaping education policy in the state.

Download Presentation

Please find below an Image/Link to download the presentation.
The content on the website is provided AS IS for your information and personal use only. It may not be sold, licensed, or shared on other websites without obtaining consent from the author. If you encounter any issues during the download, it is possible that the publisher has removed the file from their server.
You are allowed to download the files provided on this website for personal or commercial use, subject to the condition that they are used lawfully. All files are the property of their respective owners.
The content on the website is provided AS IS for your information and personal use only. It may not be sold, licensed, or shared on other websites without obtaining consent from the author.
E N D
Presentation Transcript
School Finance in Colorado: A Historical Perspective Statehood to 2008 Tracie Rainey, Executive Director Colorado School Finance Project November 16, 2020
Non-profit, non-partisan- Supported by school district contributions- School finance analysis for local and state policy makers since 1995- Governed by a board comprised of national and state experts on school finance Colorado School Finance Project Our Mission: To compile, collect and distribute research-based, non-partisan information and data on topics related to school finance for state and local policymakers. 11/16/2020 2
Why statehood plays into todays reality What has changed in Colorado our populations, demographics and funding How have the courts impacted Colorado How have ballot measures impacted K- 12 and revenue Our current funding formula deep dive into the mechanics and it s implications Goals of today area 11/16/2020 3
1982 2009 2020 1982 2020 2009 Colorado School Finance Project s School Colorado School Finance Project s School Finance and Education Reform Timeline Finance and Education Reform Timeline 11/16/2020 4
913,223 students 358,297 students eligible for Free and Reduced Lunch 106,238 students receiving special education services 125,344 Emerging Bilingual students* 66,645 students identified as Gifted 13,662 students experiencing Homelessness Who are our students? *English Language Learners is term CDE uses 11/16/2020 5
Student need has changed- Requires more services- This costs money Students of poverty are 41% population Students learning English are 14% of population approximately $.30 of every $1.00 is state funded. approximately $.20 of every $1.00 is state funded. Students with special needs are 11% of population Gifted students are 7% of population approximately $.30 of every $1.00 is state funded. approximately $.15 of every $1.00 is state funded 11/16/2020
Education clause at the state level In Colorado local school districts determine configuration of systems, curriculum, hiring and salaries and budgets Statehood Local school districts given taxing authority School districts have no control of their state local share of funding or the residential and non-residential proportions of funding 11/16/2020 7
State & Local Share Varies (by design) State & Local Share Varies (by design) District A District B LOCAL SHARE Local District Taxes: Property Taxes Ownership Tax LOCAL SHARE Local District Taxes: Property Taxes Ownership Tax STATE SHARE State Taxes: General Fund Education Fund STATE SHARE State Taxes: General Fund Education Fund 8 11/16/2020
School District's Total Assessed Value (AV)- FY 2019-20 School District's Assessed Value (AV) Per Pupil FY 2019-20 $20.7B-$7B (323,637 students) $6.9M-$1M (3,651 students) 6 5 5 15 23 $999,999-$500,000 (16,995 students) 18 $4.1B- $1B (364,532 students) 40 $499,999-$100,000 (535,536 students) $979M- $100M (157,982 students) 80 65 $99,999-$50,000 (266,654 students) $97M- $10M (30,421) Less than $49,999 (54,742 students) 99 Less than $9M (922 students) 11/16/2020 9
Colorados State Constitution Article IX, Section 2- the Education Clause Thorough and Uniform Article IX Section 15- Local control Local revenue sole source of funding for school districts Statehood to Brown v. BOE Brown v. Board of Education (1954) 11/16/2020 10
Nation at Risk report special education Title IX women participation in sports Federal Lunch Program - poverty Civil unrest and desegregation busing, boundaries Federal and State have some financial responsibility- the 1960s 11/16/2020 11
Equity taxpayer More state responsibility to address funding in equities Development of Equalization or Foundation formulas Lujan lawsuit (1982) settled out of court with 1994 act 1970s and 80s 11/16/2020 12
Gallagher Amendment Article X, Section 3 and 15 of Colorado Constitution 1982 and 1992 TABOR Article X, Section 20 of Colorado Constitution 11/16/2020 13
11/16/2020 14
Gallagher's Effect Tax Rates Over Time 30% Non-Residential Assessment Rate- 29% 25% 21% 20% 15% 10% 7.15% 5% 0% Prior to 1983 1983-1986 1987 1988 1989 - 1990 1991 - 1992 1993 - 1994 1995 - 1996 1997 - 2000 2001 - 2002 2003 - 2016 2017 - 2018 2019 - 2020 11/16/2020 15
RESIDENTIAL ASSESSMENT RATE ENACTED INTO LAW Tax Year(s) Prior to 1983 1983-1986 1987 1988 1989 - 1990 1991 - 1992 1993 - 1994 1995 - 1996 1997 - 2000 2001 - 2002 2003 - 2016 2017 - 2018 Rate 30% 21% 18% 16% 15% 14.34% 12.86% 10.36% 9.74% 9.15% 7.96% 7.20% 2019 - 2020 7.15% Source: Department of Local Affairs Division of Property Taxation, 2019 Forty-Ninth Annual Report to the Governor and General Assembly, p. 31 16 11/16/2020
17 11/16/2020
Giradino Lawsuit- settled outside of court Early 1990s- School Facilities BEST (Building Excellent Schools Today) Program in 2007-08 increased capacity for school district facilities 11/16/2020 18
Created an equalization/foundation formula Recognized differences beyond control of a district and made adjustments for cost of living, size and at-risk (free lunch) 1994 School Finance Act Local revenue generated first then state backfill so starting point for every district is even Categoricals outside of formula 11/16/2020 19
11/16/2020 20
Student counts enrollment of all students in October count, additional funding for At-Risk (free lunch) for kindergarteners and pre-school (CPP) Components of the formula Enrollment numbers trued up in supplemental process about 55 days after count date this is very good quality of formula Base amount is an arbitrary number of what the state can afford it must grow by growth and inflation annually. It does not reflect the costs to educate a student with no special circumstances to the standards and accountability systems. 11/16/2020 21
Size the number of students who are in the districts membership count. Adjustment made to accommodate economies of scale Components continued At risk (students who qualify for free lunch) this adjustment is about 11% more funding (should be about 33% and expanded to reduced) 11/16/2020 22
Cost of Living market basket of goods never has been applied or funded as intended. Adjustments to all districts help as the overall formula is so underfunded. Components continued Budget Stabilization factor this reduces and distorts what a district gets in the above 3 factors. This impacts all school districts differently 11/16/2020 23
11/16/2020 24
Standards, accountability and accreditation impacts - 2000s Amendment 23 passes goal to catch K- 12 up to 1988-89 funding levels. Nothing to do with adequacy or equity Standards-Based Education No Child Left Behind calculations of a cost of education could be analyzed given the accountability expectations 11/16/2020 25
"Thorough and Uniform" Mandate of the Colorado Constitution's Education Clause Five-week trial with national and local experts Adequacy Lobato lawsuit (2013) 11/16/2020 26
The state has never analyzed what the cost of education is based on expectations of standards, accreditation and accountability. All of which can be concretely defined. Highlighted the changing demographics, the challenges in various communities and populations of students The impact of no resources and how it has impacted students, reduced programs, teachers and the profession Asked the courts to mandate the legislature for a remedy with court supervision (this has been done in multiple states) What was Lobato and why is it important 11/16/2020 27
District court findings favored the plaintiffs in a very strong decision Adequacy Lobato lawsuit (2013) continued Appealed to the Supreme Court the ruling was reversed and determined that the legislature had plenary power and must determine funding. Given that school districts met the minimal requirement of 3 months of schooling and that the state differentiated funding by at least a penny then there were different revenue distributions for school districts This set the lowest bar in the country for adequacy challenges 11/16/2020 28
School Finance Horizontal Equity- Examines if like districts treated similarly Vertical Equity- Examines how differences are treated within the system Fiscal Neutrality- Measures the relationship between the wealth of a district and the resources available to serve students School Finance Formula State funding formulas can help address equity by adjusting for student and district characteristics that are beyond district control Student needs District size Regional cost differences Equity 11/16/2020 29
Adequate PRINCIPLES: SCHOOL PRINCIPLES: SCHOOL FINANCE SYSTEM & FINANCE SYSTEM & TAX SYSTEM TAX SYSTEM Balance Sustainable Adaptable Equitable 11/16/2020 30
Trends in Per Pupil Spending - Comparing Colorado to U.S. Average FY 1991-92 to FY 2015-16 U.S. Census Ed Week Quality Counts National Center Education Statistics U.S. Average per Pupil Spending (baseline) $0 Colorado spends between $2,100 to $2,800 less per pupil than the U.S. Average. -$500 Dollars Per Pupil Below U.S. Average -$1,000 -$1,500 -$2,147 -$2,000 Comparing a variety of sources, the funding gap between Colorado and the U.S. average has continued to grow over the past 20+ years. -$2,222 -$2,500 -$2,793 -$3,000 Audited data from U.S. Census, Quality Counts, NCES Chart: Colorado School Finance Project December 2018 * Budget Stabilization Factor (mechanism to reduce PK-12 funding) incorporated in School Finance Act 11/16/2020 31
Tracie Rainey T.Rainey@cosfp.org 303-860-9136 QUESTIONS after today? Stay connected https://cosfp.org/ @COSFP Colorado School Finance Project - Facebook


")
-")