HIV and AIDS Data in Iran: Insights from Asia-Pacific Hub
Explore the latest data on HIV prevalence, socio-demographic indicators, epidemiology, and more in Iran from the HIV and AIDS Data Hub for Asia-Pacific. Discover trends in total population, HIV infections, AIDS-related deaths, and the national response. Stay informed with comprehensive information on HIV in Iran.

Download Presentation

Please find below an Image/Link to download the presentation.
The content on the website is provided AS IS for your information and personal use only. It may not be sold, licensed, or shared on other websites without obtaining consent from the author. If you encounter any issues during the download, it is possible that the publisher has removed the file from their server.
You are allowed to download the files provided on this website for personal or commercial use, subject to the condition that they are used lawfully. All files are the property of their respective owners.
The content on the website is provided AS IS for your information and personal use only. It may not be sold, licensed, or shared on other websites without obtaining consent from the author.
E N D
Presentation Transcript
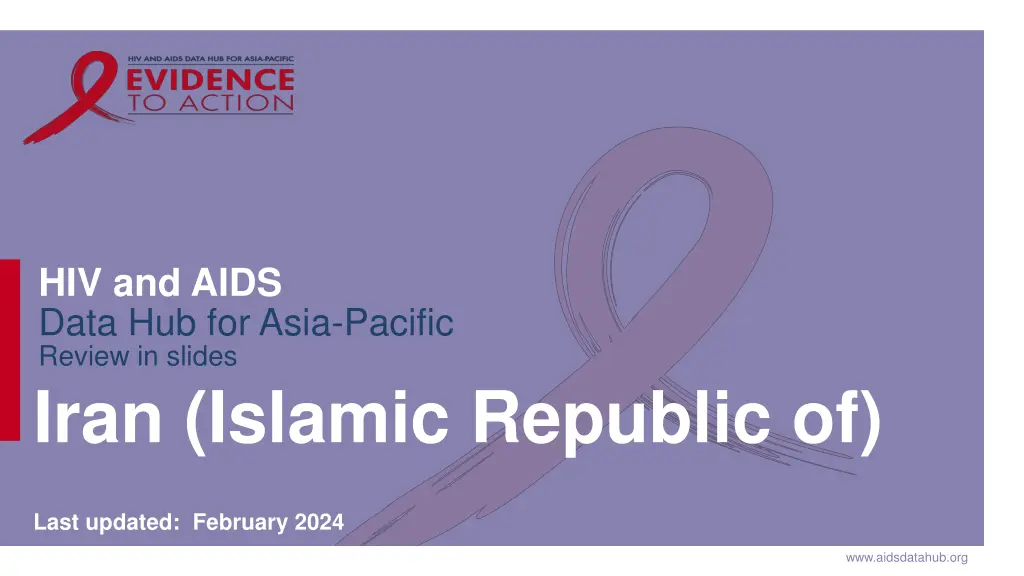
HIV and AIDS Data Hub for Asia-Pacific Review in slides Iran (Islamic Republic of) Last updated: February 2024 www.aidsdatahub.org
HIV and AIDS Data Hub for Asia-Pacific CONTENT Basic socio-demographic indicators HIV prevalence and epidemiological status Risk behaviors Vulnerability and HIV knowledge HIV expenditure National response 2
HIV and AIDS Data Hub for Asia-Pacific BASIC SOCIO-DEMOGRAPHIC INDICATORS Total population (in thousands) 83,993 (2020) 1 Population aged 15-49 (thousands) 46,268 (2020) 1 Maternal mortality ratio (per 100 000 live births) 16 (2017) 2 Antenatal care coverage - At least four visits (%) 94 (2005) 2 Crude birth rate (births per 1,000 population) 19.1 (2015-2020) 1 Under-5 mortality rate (per 1,000 live births) 13.93 (2019) 2 Human development index (HDI) - Rank/Value 70/0.783 (2014) 3 Life expectancy at birth (years) - Male/Female 76/79 (2019) 2 Current health expenditure (CHE) per capita in PPP int$ 868 (2019) 2 Total health expenditure as percent of GDP (%) 6.9 (2014) 2 Sources: Prepared by www.aidsdatahub.org based on 1. United Nations, Department of Economic and Social Affairs, Population Division (2019). World Population Prospects 2019, Online Edition. Rev. 1.; 2. Data retrieved from the WHO Global Health Observatory; and 3. UNDP. 2021. Human Development Report 2020. The next frontier: Human development and the Anthropocene
HIV prevalence and epidemiology www.aidsdatahub.org
HIV and AIDS Data Hub for Asia-Pacific Estimated people living with HIV, new HIV infections and AIDS- related deaths, 1990-2022 80,000 70,000 60,000 50,000 Number 46 000 40,000 30,000 20,000 10,000 2900 2300 - 1990 1998 2006 1991 1992 1993 1994 1995 1996 1997 1999 2000 2001 2002 2003 2004 2005 2007 2008 2009 2010 2011 2012 2013 2014 2015 2016 2017 2018 2019 2020 2021 2022 PLHIV New HIV infections AIDS-related deaths 5 Source: Prepared by www.aidsdatahub.org based on UNAIDS. (2023). UNAIDS HIV estimates 1990-2022
HIV and AIDS Data Hub for Asia-Pacific Estimated number of adults (15+) living with HIV and women (15+) living with HIV, 1990-2022 80000 70000 60000 50000 Number 45 000 40000 30000 20000 15 000 10000 0 1993 2010 1990 1991 1992 1994 1995 1996 1997 1998 1999 2000 2001 2002 2003 2004 2005 2006 2007 2008 2009 2011 2012 2013 2014 2015 2016 2017 2018 2019 2020 2021 2022 Adults (15+) living with HIV Women (15+) living with HIV 6 Source: Prepared by www.aidsdatahub.org based on UNAIDS. (2023). UNAIDS HIV estimates 1990-2022
HIV and AIDS Data Hub for Asia-Pacific Key population size estimates Key population size estimates Populations Estimate Year of estimate People who inject drugs (PWID) 90 000 2018 Female sex workers (FSW) 138 000 2018 Transgender (TG) 10 000 2020 7 Source: Prepared by www.aidsdatahub.org based on Global AIDS Monitoring
HIV and AIDS Data Hub for Asia-Pacific HIV prevalence among key populations, 2019-2020 National ... TRANSGENDER PEOPLE City ... National ... MEN WHO HAVE SEX WITH MEN City ... National 3.6 PEOPLE WHO INJECT DRUGS (2019-20) City ... National 1.6 FEMALE SEX WORKERS (2020) City ... 8 Source: Prepared by www.aidsdatahub.org based on Serological surveys and Global AIDS Monitoring
HIV and AIDS Data Hub for Asia-Pacific HIV prevalence among key populations, 2011-2020 % 16 14 12 10 TG PWID FSW 8 6 4 2 0 2011 2014 2015 2018 2020 9 Source: Prepared by www.aidsdatahub.org based on Serological surveys and Global AIDS Monitoring
Risk behaviours www.aidsdatahub.org
HIV and AIDS Data Hub for Asia-Pacific Proportion of key populations who reported condom use at last sex, 2011-2020 % 100 90 80 70 61 61 59 60 50 43 42 35 40 30 15 20 10 0 2011 2014 2015 2019 2020 FSW TG 11 Source: Prepared by www.aidsdatahub.org based on Global AIDS Monitoring
HIV and AIDS Data Hub for Asia-Pacific Proportion of PWID who reported using sterile injecting equipment at last injection, 2011-2019 % 100 90 92 80 82 70 73 60 50 40 30 20 10 0 2011 2014 2019 12 Source: Prepared by www.aidsdatahub.org based on Global AIDS Monitoring
Vulnerability and HIV knowledge www.aidsdatahub.org
HIV expenditure www.aidsdatahub.org
HIV and AIDS Data Hub for Asia-Pacific AIDS financing, 2012 AIDS spending by financing source AIDS spending by service category Other AIDS expenditures Domestic funding 96% Key populations prevention 74.5 million US$ Data not available Other prevention International funding 4% Care and treatment 15 Source: Prepared by www.aidsdatahub.org based on UNAIDS HIV Financial Dashboard
HIV and AIDS Data Hub for Asia-Pacific AIDS spending by financing source, 2006-2012 US$ million 80 70 60 50 40 30 20 10 0 2006 2008 International funding 2009 2012 Domestic funding Total AIDS spending 16 Source: Prepared by www.aidsdatahub.org based on UNAIDS HIV Financial Dashboard
National response www.aidsdatahub.org
HIV and AIDS Data Hub for Asia-Pacific Proportion of key populations who are reached with HIV prevention interventions designed for them, 2022 100 % 29.2 21.2 15.1 0 Female sex workers People who inject drugs Transgender 18 Source: Prepared by www.aidsdatahub.org based on Global AIDS Monitoring Reporting
HIV and AIDS Data Hub for Asia-Pacific HIV testing coverage among key populations, 2019-2020 % 100 90 80 67 70 60 53 50 40 30 20 10 na na 0 PWID (2019) TG FSW (2020) MSM 19 Source: Prepared by www.aidsdatahub.org based on Global AIDS Monitoring Reporting
HIV and AIDS Data Hub for Asia-Pacific Number of needles/syringes distributed per PWID per year, 2011 2022 300 Number of needles/syringes High coverage: >200 syringes per PWID per year 200 Medium coverage: >100 <200 syringes per PWID per year 86 100 80 76 74 63 51 50 48 Low coverage: <100 syringes per 43 43 34 30 PWID per year 0 20 Source: Prepared by www.aidsdatahub.org based on Global AIDS Monitoring Reporting
HIV and AIDS Data Hub for Asia-Pacific ART scale-up, 2005 - 2022 20,000 100 16,672 80 ART coverage (%) 15,000 60 Number 10,000 40 5,000 20 37 0 0 % PLHIV on ART Number of people on ART 21 Source: Prepared by www.aidsdatahub.org based on Global AIDS Monitoring and UNAIDS HIV estimates 2023
HIV and AIDS Data Hub for Asia-Pacific Treatment cascade, 2022 46,000 Number of people 46,000 23,305 16,672 12,557 11,359 0 Estimated PLHIV PLHIV who know their HIV status People on ART Tested for viral load PLHIV who have viral suppression * * Number of people on ART who received a viral load test in the past year and have viral load of <1000 copies/ml 22 Source: Prepared by www.aidsdatahub.org based on Global AIDS Monitoring and UNAIDS HIV estimates 2023
HIV and AIDS Data Hub for Asia-Pacific HIV testing and treatment cascade, 2022 % 100 95 90 86 80 60 40 51 20 37 33 0 PLHIV who know their status PLHIV on treatment PLHIV who have suppressed viral load Progress (%) Gap Target 23 Source: Prepared by www.aidsdatahub.org based on Global AIDS Monitoring and UNAIDS HIV estimates 2023
HIV and AIDS Data Hub for Asia-Pacific PMTCT cascade, 2022 500 100% 400 300 Number 200 <500 38% 33% 26% 100 143 <200 100 0 0% Estimated pregnant women living with HIV Pregnant women receiving ART to prevent vertical transmission Infants receiving a virological test for HIV within 2 months of birth New child infections 24 Source: Prepared by www.aidsdatahub.org based on Global AIDS Monitoring and UNAIDS HIV estimates 2023
HIV and AIDS Data Hub for Asia-Pacific Punitive and discriminatory laws, 2022 Laws or policies restricting the entry, stay and residence of people living with HIV Law allows for possession of a certain limited amount of drugs for personal use Parental consent for adolescents to access HIV testing Criminalization of same-sex sexual acts Criminalization of TG people Criminalization of sex work NO YES YES * NO YES * NO * For adolescents younger than 14 years * Death penalty Sources: Prepared by www.aidsdatahub.org based on UNAIDS. (2023). The path that ends AIDS: UNAIDS Global AIDS Update 2023. Geneva: Joint United Nations Programme on HIV/AIDS; 2023.
HIV and AIDS Data Hub for Asia-Pacific THANK YOU slides compiled by www.aidsdatahub.org Data shown in this slide set are comprehensive to the extent they are available from country reports. Please inform us if you know of sources where more recent data can be used. Please acknowledge www.aidsdatahub.org if slides are lifted directly from this site 26