Housing in the CPI and PCE Deflator, 2013
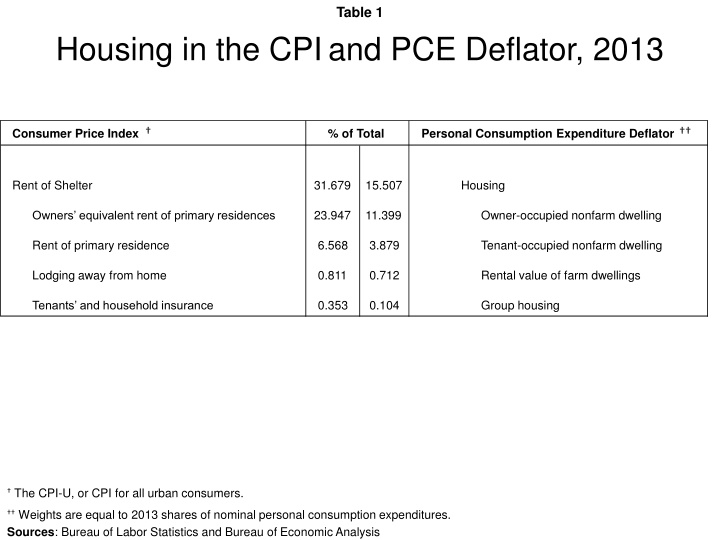
Table and charts illustrating housing data from the CPI and PCE deflator in 2013 are provided, detailing rent inflation, turnover rates, home price appreciation, and OER inflation. The construction of CPI tenant rent plus utilities inflation is also outlined in a comprehensive table.

Uploaded on Mar 12, 2025 | 1 Views
Download Presentation

Please find below an Image/Link to download the presentation.
The content on the website is provided AS IS for your information and personal use only. It may not be sold, licensed, or shared on other websites without obtaining consent from the author.If you encounter any issues during the download, it is possible that the publisher has removed the file from their server.
You are allowed to download the files provided on this website for personal or commercial use, subject to the condition that they are used lawfully. All files are the property of their respective owners.
The content on the website is provided AS IS for your information and personal use only. It may not be sold, licensed, or shared on other websites without obtaining consent from the author.
E N D
Presentation Transcript
Table 1 Housing in the CPIand PCE Deflator, 2013 Consumer Price Index % of Total Personal Consumption Expenditure Deflator Rent of Shelter 31.679 15.507 Housing 23.947 11.399 Owner-occupied nonfarm dwelling Owners equivalent rent of primary residences Rent of primary residence 6.568 3.879 Tenant-occupied nonfarm dwelling Lodging away from home 0.811 0.712 Rental value of farm dwellings 0.353 0.104 Group housing Tenants and household insurance The CPI-U, or CPI for all urban consumers. Weights are equal to 2013 shares of nominal personal consumption expenditures. Sources: Bureau of Labor Statistics and Bureau of Economic Analysis
Chart 1 Rent Inflation in the CPI % Change - Year-to-Year 7.0 % Change Year-to-Year 7.0 6.0 6.0 5.0 5.0 Owners Equivalent Rent 4.0 4.0 3.0 3.0 2.0 2.0 Rent of Primary Residence 1.0 1.0 Core CPI 0.0 0.0 -1.0 -1.0 1983 1986 1989 1992 1995 1998 2001 2004 2007 2010 2013 Source: Bureau of Labor Statistics
Chart 2 Housing Turnover, Home Price Appreciation, and OER Inflation Percent Percent 8 14 12 7 10 Turnover Rate (left axis) 6 8 5 6 4 4 2 3 0 2 OER Inflation (left axis) -2 Home Price Appreciation (right axis) 1 -4 0 -6 -1 -8 1992 1995 1998 2001 2004 2007 2010 2013 Sources: Department of Commerce, Office of Federal Housing Enterprise Oversight, and Bureau of Labor Statistics
Figure 1 Primary Sampling Unit (PSU) B1 B2 Segments A1 A2 C1 C2 Three strata (A, B, C), each representing one-third of total housing expenditures of the PSU. Each of the three strata is divided into two in a way that maximizes the difference in average rent levels between the two halves: A1, A2, etc. A sample of segments is drawn from each of the six strata, with a segments selection probability proportional to its aggregate housing expenditure.
Table 2 Construction of CPI Tenant Rent Plus Utilities Inflation (Used in Chart 3) c.1 c.2 c.3 c.4 c.5 c.6 c.7 CPI Data Annualized Change AHS Renters' Data Avg. Utility Expenditure as % of Housing Cost Avg. of Column 3 over 2-year Intervals Weighted Avg. of % of Units Paying for Utilities Separately from Rent Avg. of Column 5 over 2-year Intervals CPI Inflation for Rent + Utilities Tenant Rent Utilities 3.884 2.422 2.440 2.782 3.194 4.043 3.422 2.831 3.922 2.965 0.960 2.742 3.409 2.594 0.947 2.828 -0.739 7.962 1.449 7.637 5.873 2.476 2.253 1.106 14.696 14.043 14.767 14.002 12.583 11.635 12.100 11.479 12.155 14.709 15.023 14.636 14.369 14.405 14.385 13.293 12.109 11.867 11.790 11.817 13.432 14.866 14.830 13.357 88.838 89.629 89.961 90.422 87.113 87.815 88.373 88.266 87.737 87.674 88.798 89.380 89.233 89.795 90.191 88.768 87.464 88.094 88.320 88.002 87.705 88.236 89.089 89.595 3.830 2.450 2.245 2.793 2.770 4.472 3.216 3.351 4.169 2.906 1.139 2.546 1989-1991 1991-1993 1993-1995 1995-1997 1997-1999 1999-2001 2001-2003 2003-2005 2005-2007 2007-2009 2009-2011 2011-2013 [(c.1 [c.4 * (1 c.6)] * c.2) * (1 c.4)] + (c.2 * c.4) [(1 c.4) * (1 c.6)] + c.6 Formula for Tenant Rent CPI Inflation: Sources: American Housing Survey, Consumer Price Index, and authors calculations
Chart 3 Tenant Rent Inflation: AHS and CPI Measures % Change Annual Rate % Change Annual Rate 7.0 7.0 CPI AHS Raw Data Expenditure-Weighted Growth Pooled Regression Expenditure-Weighted Predicted Growth 6.0 6.0 5.0 5.0 4.0 4.0 3.0 3.0 2.0 2.0 1.0 1.0 0.0 0.0 '91-'93 '93-'94 '95-'97 '97-'99 '99-'01 '01-'03 '03-'05 '05-'07 '07-'09 '09-'11 '11-'13 Note: American Housing Survey calculations made with trimming. Sources: Bureau of Labor Statistics, American Housing Survey, and authors calculations
Table 3 Coefficients from Pooled Housing Cost Change Regression No Trimming Bacon Log of Lagged Housing Cost (t-2) Multifamily Building Dummy Midwest Dummy South Dummy West Dummy Suburban Dummy Rural Dummy Midwest x Suburban Midwest x Rural South x Suburban South x Rural West x Suburban West x Rural -4.5350*** -2.448*** 1.150* -0.493* -2.091 -2.638*** -2.409* -2.083*** -1.053 -1.547*** -0.227 -1.523** -3.813* -2.318** -0.764 1.422 3.129 1.796 1.172 1.713* 3.427 2.330* 0.0214 1.344* 3.691 2.497* Sq. Feet -0.000210 0.0000471 Change in Sq. Feet Neighborhood Rating Change in Neighborhood Rating 1993 1995 1997 1999 2001 2003 2005 2007 2009 2011 Constant Observations R^2 Root Mean Squared Error -0.000090 -0.0000964 0.256 0.00677 0.109 -0.137* 0.700 0.668 1.147 -0.0939 4.757** 2.708*** 4.251** 3.321*** 3.268*** 5.763*** -0.409 2.415*** 4.950*** 3.268*** 4.853*** 2.893*** 2.884** 0.458 2.337* -0.129 30.77*** 20.31*** 42473 42028 0.005 45.76 0.010 21.10 100 square feet = one unit. Positive numbers represent an improvement in neighborhood rating. Note:*, **, *** stands for significance at the 10, 5, and 1 percent levels, respectively. Fixed time effects (not reported) included in the regression. Sources: American Housing Survey and authors calculations
Table 4 Tenant Rent and OER Inflation: AHS vs. CPI 91-'93 93-'95 95-'97 97-'99 99-'01 01-'03 03-'05 05-'07 07-'09 09- 11 11- 13 Tenant Rent CPI 2.4 2.2 2.8 2.8 4.5 3.2 3.4 4.2 2.9 1.1 2.5 3.2 3.7 2.8 5.5 5.8 1.6 4.3 5.1 4.5 2.1 1.4 Pooled Regression 95% Confidence Interval (1.1, 5.4) (1.6, 5.8) (0.8, 4.7) (3.5, 7.6) (3.8, 7.9) (-0.7, 4.0) (1.9, 6.8) (2.6, 7.6) (2.0, 7.1) (-0.3, 4.6) (-0.9, 3.7) 0.8 1.5 0.0 2.7 1.3 -1.6 0.9 0.9 1.6 1.0 -1.1 Difference 1.443 RMSE Owners' Equivalent Rent CPI 3.2 2.9 3.0 2.3 4.3 2.9 3.4 4.0 2.2 1.1 1.8 2.5 3.1 2.2 5.0 5.5 1.6 4.5 5.5 5.6 3.3 2.7 OER Pooled Regression 95% Confidence Interval (0.5, 4.5) (1.2, 5.1) (0.3, 4.1) (3.1, 6.9) (3.3, 7.7) (-0.3, 3.6) (2.5, 6.4) (3.3, 7.7) (2.9, 8.3) (0.4, 6.3) (0.1, 5.4) -0.7 0.2 -0.8 2.7 1.2 -1.3 1.1 1.5 3.4 2.2 0.9 Difference 1.796 RMSE Tenant Rent CPI calculations documented in Table 2. Owners Equivalent Rent CPI calculations documented in Table TEMP. Note: American Housing Survey calculations made with trimmed data. Expenditure-weighted, annualized predicted growth rates reported. Sources: American Housing Survey and Bureau of Labor Statistics
Chart 4 CES Rent-Price Ratio Estimated Monthly Rent and Utilities ($) Estimated Monthly Rent and Utilities ($) 2500 2500 1991: Y = -2.25*10-8X2 + 0.0105X + 65.495 2001: Y = -2.09*10-8X2 + 0.1269X - 4.3101 2000 2000 2011: Y = -1.17*10-8X2 + 0.0105X + 41.5337 1500 1500 1000 1000 500 500 0 0 0 50000 100000 150000 Reported Home Value ($) 200000 250000 300000 350000 Sources: Bureau of Labor Statistics and Haver Analytics
Table 5 Construction of CPI Owners Equivalent Rent + Utilities Inflation (Used in Chart 5) c.1 c.2 c.3 c.4 c.5 CPI Data Annualized Change AHS Owners' Data Avg. Utility Expenditure as % of Housing Cost CPI Inflation for Owners' Equivalent Rent + Utilities Avg. of Column 3 over 2-year Intervals Owners' Equivalent Rent Utilities 4.639 3.303 3.309 3.042 2.986 3.404 3.253 2.295 3.437 2.085 0.572 2.118 3.409 2.594 0.947 2.828 -0.739 7.962 1.449 7.637 5.873 2.476 2.253 1.106 18.798 19.198 20.022 18.704 19.783 19.109 21.396 19.614 21.996 28.140 30.865 30.596 18.998 19.610 19.363 19.243 19.446 20.253 20.505 20.805 25.068 29.502 30.730 29.175 4.405 3.164 2.852 3.001 2.263 4.325 2.890 3.402 4.046 2.199 1.094 1.819 1989-1991 1991-1993 1993-1995 1995-1997 1997-1999 1999-2001 2001-2003 2003-2005 2005-2007 2007-2009 2009-2011 2011-2013 Formula for OER CPI Inflation: [c.1 * c.4] + [c.2 * (1 c.4)] Calculated by averaging each unit s monthly utility expenditures divided by estimated monthly rent and utilities (estimated using reported home value and the methodology documented in Chart 4). Sources: American Housing Survey, Consumer Price Index, Bureau of Labor Statistics, and authors calculations
Chart 5 OER Inflation: AHS and CPI Measures % Change Annual Rate % Change Annual Rate 7.0 7.0 CPI Pooled Regression Expenditure-Weighted Predicted Growth 6.0 6.0 5.0 5.0 4.0 4.0 3.0 3.0 2.0 2.0 1.0 1.0 0.0 0.0 '91-'93 '93-'94 '95-'97 '97-'99 '99-'01 '01-'03 '03-'05 '05-'07 '07-'09 '09-'11 '11-'13 Note: American Housing Survey calculations made with trimming. Sources: Bureau of Labor Statistics, American Housing Survey, and authors calculations
Chart 6 Distribution of Predicted Housing-Cost Inflation: 2009-11 Density 0.6 Renter-Occupied Units Unweighted Expenditure-Weighted 0.4 Weighted Mean: 2.15 Mean: 2.65 0.2 0.0 -3 -2 -1 0 1 2 3 4 5 6 7 8 9 10 11 12 13 14 15 16 17 18 19 20 0.6 Owner-Occupied Units Unweighted Expenditure-Weighted 0.4 Weighted Mean: 3.35 Mean: 2.70 0.2 0.0 -3 -2 -1 0 1 2 3 4 5 6 7 8 9 10 11 12 13 14 15 16 17 18 19 20 Annualized Rent Inflation Note: Empirical distributions smoothed using a normal kernel with bandwidth parameter of 0.2404 for renters and 0.1482 for owners. Source: American Housing Survey
Chart 7 Distribution of Predicted Housing-Cost Inflation by Housing-Cost Quintile: 2009-11 Density 0.6 Renter-Occupied Units Quintile 1 (Lowest) Quintile 2 Quintile 3 Quintile 4 Quintile 5 (Highest) 0.4 0.2 0.0 -3 -2 -1 0 1 2 3 4 5 6 7 8 9 10 11 12 13 14 15 16 17 18 19 20 0.6 Owner-Occupied Units Quintile 1 (Lowest) Quintile 2 Quintile 3 Quintile 4 Quintile 5 (Highest) 0.4 0.2 0.0 -3 -2 -1 0 1 2 3 4 5 6 7 8 9 10 11 12 13 14 15 16 17 18 19 20 Annualized Rental Growth Note: Empirical distributions smoothed using a normal kernel with bandwidth parameter of 0.2404 for renters and 0.1482 for owners. Expenditure-weighted results reported. Source: American Housing Survey
Table 6 Housing Cost and Utilities by Housing-Cost Quintile Period Lowest 5th Median Housing Cost $248 Median Monthly Utilities Cost $57 Proportion of Total 22.9% Median Housing Cost $264 Median Monthly Utilities Cost $59 Proportion of Total 22.3% Median Housing Cost $302 Median Monthly Utilities Cost $97 Proportion of Total 32.1% Median Housing Cost $305 Median Monthly Utilities Cost $96 Proportion of Total 31.4% Median Housing Cost $355 Median Monthly Utilities Cost $88 Proportion of Total 24.6% Median Housing Cost $361 Median Monthly Utilities Cost $55 Proportion of Total 15.3% Median Housing Cost $354 Median Monthly Utilities Cost $51 Proportion of Total 14.4% Median Housing Cost $371 Median Monthly Utilities Cost $54 Proportion of Total 14.4% Median Housing Cost $398 Median Monthly Utilities Cost $67 Proportion of Total 16.8% Median Housing Cost $397 Median Monthly Utilities Cost $69 Proportion of Total 17.4% Median Housing Cost $413 Median Monthly Utilities Cost $72 Proportion of Total 17.5% 4th 3rd 2nd Highest 1st 1991-1993 $368 $61 16.6% $396 $69 17.4% $399 $113 28.3% $419 $106 25.3% $468 $90 19.2% $512 $66 12.9% $522 $65 12.5% $554 $70 12.6% $601 $91 15.1% $623 $102 16.4% $645 $110 17.1% $460 $65 14.1% $496 $72 14.5% $499 $112 22.3% $525 $112 21.3% $581 $95 16.3% $628 $64 10.2% $649 $65 10.0% $687 $72 10.5% $755 $103 13.6% $784 $113 14.4% $818 $116 14.2% $571 $64 11.2% $615 $70 11.4% $649 $121 18.6% $668 $120 18.0% $711 $106 14.9% $779 $71 9.1% $796 $72 9.1% $836 $82 9.8% $930 $108 11.6% $972 $122 12.6% $1,033 $130 12.6% $775 $71 9.2% $835 $87 10.4% $981 $126 12.9% $957 $132 13.8% $996 $117 11.7% $1,083 $83 7.7% $1,109 $77 7.0% $1,188 $81 6.8% $1,312 $116 8.8% $1,378 $127 9.2% $1,463 $137 9.4% 1993-1995 1995-1997 1997-1999 1999-2001 2001-2003 2003-2005 2005-2007 2007-2009 2009-2011 2011-2013 Note: Quintiles are derived from the trimmed renters data set. Housing costs include monthly rent and utilities, where utilities include average payments for electricity, gas, fuel oil, and other fuels, water and sewage, garbage and trash. Source: American Housing Survey
Table 7 Utilities and Rent Inflation by Housing-Cost Quintile Lowest 5th Monthly Total Housing Cost 8.9% Rent 8.8% Utilities 9.5% Monthly Total Housing Cost 11.8% Rent 13.4% Utilities 7.0% Monthly Total Housing Cost 10.2% Rent 15.9% Utilities -0.1% Monthly Total Housing Cost 15.7% Rent 18.9% Utilities 8.7% Monthly Total Housing Cost 14.4% Rent 12.3% Utilities 20.3% Monthly Total Housing Cost 10.3% Rent 11.0% Utilities 7.1% Monthly Total Housing Cost 15.1% Rent 15.4% Utilities 13.6% Monthly Total Housing Cost 14.4% Rent 13.4% Utilities 19.2% Monthly Total Housing Cost 16.3% Rent 16.8% Utilities 14.6% Monthly Total Housing Cost 12.8% Rent 13.6% Utilities 9.8% Monthly Total Housing Cost 12.9% Rent 15.9% Utilities 0.9% Period 1991-1993 4th 3rd 2nd Highest 1st 4.9% 4.4% 7.2% 4.4% 4.4% 4.5% 5.4% 6.6% 2.2% 7.3% 7.7% 5.9% 7.3% 6.8% 9.3% 4.6% 4.7% 3.8% 6.2% 5.9% 8.5% 7.8% 5.8% 19.1% 7.9% 7.2% 10.8% 4.7% 4.7% 4.9% 2.6% 4.1% -4.2% 3.0% 2.7% 4.5% 2.4% 2.9% -0.8% 4.1% 4.4% 2.9% 3.3% 4.9% -2.2% 5.8% 5.6% 6.5% 2.2% 2.2% 2.4% 4.1% 3.1% 11.1% 5.0% 3.5% 14.4% 3.5% 3.1% 5.9% 1.2% 1.0% 1.9% 0.2% 1.0% -4.0% 2.1% 1.7% 4.6% 1.4% 1.7% 0.0% -0.3% -0.3% -0.1% 0.6% 1.0% -0.9% 1.9% 2.0% 1.3% 1.1% 1.6% -2.8% 1.5% 1.1% 5.0% 2.5% 1.2% 12.3% 1.1% 0.7% 2.9% -0.8% -0.8% -0.8% -0.7% 0.8% -9.8% -0.6% -1.0% 2.4% 0.1% 0.6% -4.0% -1.8% -1.9% -1.5% 3.5% 4.2% -1.3% 1.0% 0.8% 2.3% -6.8% -6.4% -11.1% -1.1% -1.2% 0.3% -3.1% -4.0% 7.2% -3.2% -3.4% -1.0% -2.8% -2.7% -3.8% -1.5% -0.4% -11.4% 1993-1995 1995-1997 1997-1999 1999-2001 2001-2003 2003-2005 2005-2007 2007-2009 2009-2011 2011-2013 Note: Quintiles and percent changes are derived from the trimmed renters data set. Expenditure-weighted, annualized growth rates reported. Utilities include average payments for electricity, gas, fuel oil, and other fuels, water and sewage, garbage and trash. Source: American Housing Survey
Chart 8 Utilities Inflation: AHS and CPI Measures % Change Annual Rate % Change Annual Rate 12 12 9 9 6 6 AHS (3rd Quintile) 3 3 0 0 CPI -3 '91-93 Note: AHS percent changes are reported for the 3rd quintile (see Table 6) . AHS utilities include average payments for electricity, gas, fuel oil, and other fuels, water and sewage, garbage and trash. CPI series prior to 1999 is for energy services only. After 1999 it is a weighted average of energy services and water, sewage, and trash removal services. -3 '95-97 '99-01 '03-05 '07-09 '11-13 Sources: Bureau of Labor Statistics, American Housing Survey
Table 8 Housing Unit Dynamics by Income Quintiles (Millions of Units) Total Income Range ($) Change Due To Change in Units 1989-2013 Within Tenure Net Filtering Cross Tenure Net Filtering New Net Within Quintile Switches 1989 2013 Income Quintile Construction Conversions 0 - 10,999 11,000 - 21,399 21,400 - 31,999 32,000 - 50,999 51,000 - 400,000 0 - 17,986 17,987 - 34,973 34,974 - 58,399 58,400 - 97,899 97,900 - 1,061,921 1 - lowest 2 3 4 5 - highest Total 4.51 4.47 5.27 4.03 4.34 22.61 -1.52 0.26 1.70 0.62 -1.06 0.00 -0.39 0.32 0.52 0.21 -0.66 0.00 3.09 4.44 6.03 8.00 10.76 32.33 3.32 -0.54 -2.98 -4.80 -4.71 -9.71 - - - - - Renter-Occupied Income Range ($) Change Due To Change in Units 1989-2013 Within Tenure Net Filtering Cross Tenure Net Filtering New Net Within Quintile Switches 1989 2013 Income Quintile Construction Conversions 0 - 7,199 7,200 - 13,999 14,000 - 21,999 22,000 - 32,824 32,825 - 266,000 0 - 9,986 9,984 - 21,459 21,460 - 34,986 34,987 - 56,999 57,000 - 730,873 1 - lowest 2 3 4 5 - highest Total 2.98 1.45 1.54 0.23 0.56 6.76 0.59 0.96 0.38 -1.10 -0.83 0.00 0.70 0.94 0.83 0.64 0.20 3.31 1.55 1.54 1.39 0.94 0.77 6.19 -0.05 -2.27 -0.78 -0.18 0.42 -2.86 0.19 0.27 -0.28 -0.07 0.00 0.11 Owner-Occupied Income Range ($) Change Due To Change in Units 1989-2013 Within Tenure Net Filtering Cross Tenure Net Filtering New Net Within Quintile Switches 1989 2013 Income Quintile Construction Conversions 0 - 14,795 14,796 - 25,999 26,000 - 39,999 40,000 - 59,999 60,000 - 400,000 0 - 25,036 25,037 - 45,986 45,987 - 72,999 73,000 - 114,960 114,961 - 1,061,921 1 - lowest 2 3 4 5 - highest 1.53 3.03 3.73 3.79 3.78 -2.11 -0.70 1.32 1.72 -0.23 -1.10 -0.62 -0.31 -0.43 -0.86 1.55 2.89 4.64 7.06 9.99 3.37 1.73 -2.21 -4.62 -5.13 -0.19 -0.27 0.28 0.07 0.00 Total 15.85 0.00 -3.31 26.13 -6.86 -0.11 Note: Income ranges represent nominal incomes. Income quintiles have been deflated to 2009 dollars using the PCE deflator. Source: American Housing Survey
Table for Box 3 Hypothetical Example of CPI Methodology Sample (Observed) 3 Universe (Estimated) Segments 20 10 1 10 2 Row 1 A 1 B 1 C 2 Type Units Renters Owners Total 100 150 250 100 150 250 150 100 250 350 400 750 2,500 2,500 5,000 1,000 1,500 2,500 1,500 1,000 2,500 Rent Level (Period 1) Tenants' Rent OER Housing Expenditures Renters Owners Total Row 2 Probability of Segment's Inclusion in Sample Row 3 Segment Weight Number of Sampled Units Renters Owners Row 4 Total Row 5 Ratio of Total to Sampled Units (HU/SU) 10 Row 6 Renters' Share of Total Housing Costs (RC/TC) 0.4 Row 7 Owners' Share of Total Housing Costs (OC/TC) Rent Change Calculation Renters Renters' Weight Total Rent Period 1 Total Rent Period 2 Row 8 Percent Change Owners Owners' Weight Total Rent Period 1 Total Rent Period 2 Row 9 Percent Change 400 400 400 400 200 200 40,000 60,000 100,000 0.067 15 40,000 60,000 100,000 0.067 15 30,000 20,000 50,000 0.033 30 110,000 140,000 250,000 700,000 800,000 1,500,000 1,000,000 400,000 600,000 300,000 200,000 500,000 10 15 25 10 15 25 15 10 25 10 0.4 0.6 10 0.6 0.4 0.6 60 60 180 36,000 36,720 2.00% 24,000 24,960 4.00% 24,000 24,960 4.00% 84,000 86,640 3.14% 700,000 722,000 3.14% 400,000 416,000 4.00% 300,000 306,000 2.00% 90 90 120 24,000 24,480 2.00% 36,000 37,440 4.00% 36,000 37,440 4.00% 96,000 99,360 3.50% 800,000 828,000 3.50% 600,000 624,000 4.00% 200,000 204,000 2.00% Unobserved; estimate based on property value