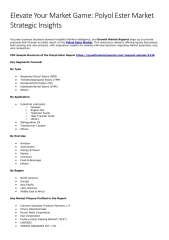
How to Make a Market Map for Strategic Business Insights

A market map is a valuable tool for breaking down sales data into competitor and market segment categories, allowing businesses to visualize market opportunities, identify areas for growth or consolidation, and make informed strategic decisions. This comprehensive guide covers what a market map is, its importance, where to find data, the process of building one using Mekko Graphics, and tips for creating impactful charts. Learn how market maps help companies understand market dynamics and optimize their positioning for success.

Download Presentation

Please find below an Image/Link to download the presentation.
The content on the website is provided AS IS for your information and personal use only. It may not be sold, licensed, or shared on other websites without obtaining consent from the author.If you encounter any issues during the download, it is possible that the publisher has removed the file from their server.
You are allowed to download the files provided on this website for personal or commercial use, subject to the condition that they are used lawfully. All files are the property of their respective owners.
The content on the website is provided AS IS for your information and personal use only. It may not be sold, licensed, or shared on other websites without obtaining consent from the author.
E N D
Presentation Transcript
CBA Results Files Filling in the templates
Getting started We highly encourage you to > Read the CBA Methodology: Annex F on Methodology of TYNDP 2015 http://www.entsog.eu/public/uploads/files/publications/TYNDP/2015/TYNDP022- 150316_Annex_F_lowres.pdf And ESW-CBA Methodology http://www.entsog.eu/public/uploads/files/publications/CBA/2015/INV0175- 150213_Adapted_ESW-CBA_Methodology.pdf > Read the TYNDP 2015 http://www.entsog.eu/publications/tyndp#ENTSOG-TEN-YEAR-NETWORK- DEVELOPMENT-PLAN-2015 2
Overview of CBA ENTSOG Promoters JRC CBA Fin. Template FNPV FRR F C/B ratio Capacity-based Indicators (excl. Bidirect) Qual. Template Modelling results JRC Disruption rate & Remaining Flexibility Methodology Indicators Monetized results (country level) Econ. Template ENPV ERR E C/B ratio Monetization (EU level) 3
Result files 12 Result files provided to all promoters for each Group of projects > DISRUPTED RATE > DISRUPTED QUANTITY > REMAINING FLEXIBILITY > INDICATORS Modelling results > MONETIZATION > MARGINAL PRICE > GPI > FLOWS > CO2 and demand Capacity-based indicators results > IMPORT ROUTE DIV > N-1 ESW CBA Economic Template > Economic Template 5
Result files Units of the files Units % of country (or balancing zone* ) demand GWh/d % of country (or balancing zone* ) demand SSPDi = % of supply price diversification on country Gas Bill SSPDe= % of supply price dependence of country Gas Bill USSD/CSSD= % of country demand on yearly basis EUR/d EUR/GWh EUR/GWh GWh/d CO2= in tons demand= in GWh no unit (HHI index) % of country demand Bill components= 10^6 EUR/year daily basis daily basis daily basis yearly basis yearly basis yearly basis daily basis DISRUPTED RATE DISRUPTED QUANTITY REMAINING FLEXIBILITY INDICATORS MONETIZATION MARGINAL PRICE GPI FLOWS CO2 and demand daily basis daily basis daily basis IMPORT ROUTE DIV N-1 Economic template daily basis yearly basis *: for country having more than 1 balancing zone 6
Result files Results provided at country (or balancing zone* ) level country level country (or balancing zone* ) level country level country level country level EU level country (or balancing zone* ) level country (or balancing zone* ) level EU level EU level country (or balancing zone* ) level country level EU level DISRUPTED RATE DISRUPTED QUANTITY REMAINING FLEXIBILITY INDICATORS MONETIZATION MARGINAL PRICE GPI FLOWS CO2 and demand IMPORT ROUTE DIV N-1 Economic template *: for country having more than 1 balancing zone 7
CBA Templates 1 CBA (Economic + Qualitative + Financial) per Group of projects > For each Group of projects, the same modelling results have been provided to all promoters in the Group of projects > For each Group of projects, promoters have to coordinate to fill the Group CBA Share cost and revenue data to fill in the Economic and Financial Templates Discuss the modelling results to fill in the Qualitative Template 8
Economic Template Benefits > already filled in by ENTSOG > In EPI_Calculation Sheet > Based on monetized benefits referring to MONETIZATION > Unit: 10^6 EUR/year > Filled in for GREEN and GREY global contexts LOW and HIGH Infrastructure Scenario The 13 Price Configurations Costs > To be filled in by promoters > In Inputs Sheet > Aggregated CAPEX and OPEX for all projects within the Group of projects > Unit: 10^6 EUR/year 10
Qualitative Template Section 2. Group Benefits > 2 sub-sections, Specific Criteria and Other Benefits, based on TEN-E Regulation, Art 4 2 (b): 12
Qualitative Template Section 2. Specific criteria > to fill in Specific criteria sub-section based on simulation results, refer to the below matrix of the ESW-CBA Methodology (**) (**) http://www.entsog.eu/public/uploads/files/publications/CBA/2015/INV0175-150213_Adapted_ESW- CBA_Methodology.pdf 13
Qualitative Template Section 2. Apply to MS accessing a single supply source in the Initial Situation. In such cases, Refer to increases in INDICATORS / SSPDi Section 2. Group Description In initial situation, bottleneck between 2 neighbouring countries (or BZ) are reflected by differences in the value of indicators. In such cases, refer to decreased difference between 2 neighbouring countries for - INDICATORS : CSSD, SSPDe, SSPDi - MARGINAL PRICE Refer to REMAINING FLEXIBILITY Refer to increase in INDICATORS / SSPDi Refer to decrease in IMPORT ROUTE DIV CO2 Emissions: refer to decrease in tons of CO2 in CO2 and demand Other items: refer to your answer to section 4.4. and 4.5. of the Qualitative Template 14
Qualitative Template Section 4.1. Section 4.1. Identification of the significantly impacted countries and the Area of Analysis Refer to Result Files providing results at country or balancing zone level to identify the Impacted Area based on simulation results Results provided at country (or balancing zone* ) level country level country (or balancing zone* ) level country level country level country level EU level country (or balancing zone* ) level country (or balancing zone* ) level EU level EU level country (or balancing zone* ) level country level EU level DISRUPTED RATE DISRUPTED QUANTITY REMAINING FLEXIBILITY INDICATORS MONETIZATION MARGINAL PRICE GPI FLOWS CO2 and demand IMPORT ROUTE DIV N-1 Economic template 15 *: for country having more than 1 balancing zone
Qualitative Template Section 4.2. (1/3) Section 4.2. Comments on the Quantitative and Monetary Analysis of the TYNDP Step of ESW-CBA Refer to DISRUPTED RATE DISRUPTED QUANTITY REMAINING FLEXIBILITY Under - normal situation - any meaningful route disruption scenario Comment on - complementarity with other projects - competition with other projects Refer to INDICATORS - CSSD (Cooperative Supply Source Dependence) - and/or USSD (Uncooperative Supply Source Dependence) For - any meaningful supply source Comment on - complementarity with other projects - competition with other projects 16
Qualitative Template Section 4.2. (2/3) Section 4.2. Comments on the Quantitative and Monetary Analysis of the TYNDP Step of ESW-CBA Refer to INDICATORS - SSPDe (Supply Source Price Dependence) For - any meaningful supply source Comment on - complementarity with other projects - competition with other projects Refer to INDICATORS - SSPDi (Supply Source Price Diversification) For - any meaningful supply source Comment on - complementarity with other projects - competition with other projects 17
Qualitative Template Section 4.2. (3/3) Section 4.2. Comments on the Quantitative and Monetary Analysis of the TYNDP Step of ESW-CBA Refer to MARGINAL PRICE For any meaningful Price Configuration Comment on - complementarity with other projects - competition with other projects Price convergence refers to the spread between EU countries Marginal Prices. Comment on the impact of the Group on this spread, if any. Refer to MONETIZATION (and potentially GPI) For any meaningful Price Configuration Comment on - complementarity with other projects - competition with other projects 18
Qualitative Template Section 4.3. Section 4.3. Capacity Based Indicator Results and Comments Refer to N-1 ESW CBA Indicator to be calculated and commented upon by promoters Refer to IMPORT ROUTE DIV 19
Qualitative Template Section 4.3. Bi-Directional Project Indicators (1/3) > to be calculated by promoters > Refer to ESW-CBA Methodology (**) p 34&35 http://www.entsog.eu/public/uploads/files/publications/CBA/2015/INV0175- 150213_Adapted_ESW-CBA_Methodology.pdf > 2 indicators BDPi at Interconnection Point level BDPz at cross-zone level (**) http://www.entsog.eu/public/uploads/files/publications/CBA/2015/INV0175-150213_Adapted_ESW- CBA_Methodology.pdf 20
Qualitative Template Section 4.3. Bi-Directional Project Indicators (2/3) > BDPi 21
Qualitative Template Section 4.3. Bi-Directional Project Indicators (3/3) > BDPz 22
Financial Template No modelling results needed to fill in the Template Explanations to fill in the template > Refer to Tutorial Sheet included in the provided file 24
Thank You for Your Attention ENTSOG -- European Network of Transmission System Operators for Gas Avenue de Cortenbergh100, B-1000 Brussels celine.heidrecheid@entsog.eu; adam.balogh@entsog.eu EML: WWW: www.entsog.eu


")
")
")