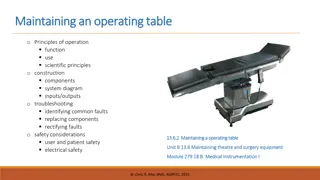
How to Present Study Results Using Tables & Figures

Referring to data in tables and figures is crucial for presenting study results effectively. This guide explores various ways to refer to tables and figures, including the use of brackets, active and passive voice, and providing detailed descriptions of the visual data. Tips such as capitalizing 'Figure' or 'Table,' using concise references, and utilizing a mix of verbs in active and passive voice are also discussed to enhance the presentation of research findings.

Uploaded on Mar 03, 2025 | 2 Views
Download Presentation

Please find below an Image/Link to download the presentation.
The content on the website is provided AS IS for your information and personal use only. It may not be sold, licensed, or shared on other websites without obtaining consent from the author.If you encounter any issues during the download, it is possible that the publisher has removed the file from their server.
You are allowed to download the files provided on this website for personal or commercial use, subject to the condition that they are used lawfully. All files are the property of their respective owners.
The content on the website is provided AS IS for your information and personal use only. It may not be sold, licensed, or shared on other websites without obtaining consent from the author.
E N D
Presentation Transcript
How to present the results of your study Section 2 Lecture 1: How to refer to data in tables and figures
Referring to tables and figures: Brackets FTIR spectra of the 0.01 M HCl extract confirmed the presence of -sheet structures (Figure 1a). In addition, TEM images indicated the presence of wormlike protein fibrils of variable sizes (Figures 1e,f and S1). [from Monge Morera M. et al. (2020). Processing Induced Changes in Food Proteins: Amyloid Formation during Boiling of Hen Egg White. Biomacromolecules. https://dx.doi.org/10.1021/acs.biomac.0c00186]
Referring to tables and figures: Passive voice The standard state case is shown as a reference in Fig. 5 (top). [from Stegemann, S. et al. 2020. Production of intense mass separated 11C beams for PET-aided hadron therapy. Nuclear Inst. and Methods in Physics Research B 463, pp. 403 407] The results of such characterisation, including particle size distribution and the microstructure, are presented in Fig. 1. [from Pallares Pallares, A. et al. 2018. Process-induced cell wall permeability modulates the in vitro starch digestion kinetics of common bean cotyledon cells. Food Funct., 9, 6545] As can be seen in Figure 1, most respondents (67%) worked in a language school. [from Kiczkowiak, M. (2020). Recruiters Attitudes to Hiring Native and Non-Native Speaker Teachers: An International Survey. TESL-EJ: Teaching English as a Second or Foreign Language, 24(1).]
Referring to tables and figures: Active voice Figure 5 graphically illustrates some of the relevant fundamental findings on these air-water interfacial properties of GHs which were at the basis of the current proof-of-concept work. Agent in Food: Incorporation in a Meringue Recipe as a Proof of Concept. Food Science 83(8),2119 2126] Fig. 6 shows that BN follows paralinear oxidation kinetics. [from Stegemann, S. et al. 2020. Production of intense mass separated 11C beams for PET-aided hadron therapy. Nuclear Inst. and Methods in Physics Research B 463, pp. 403 407] [from Woutersetal.(2018).EnzymaticallyHydrolyzedWheatGlutenasaFoaming
Referring to tables and figures: Some tips Always capitalise Figure or Table Only use Figure or Table + number You can shorten Figure to Fig. Never shorten Table You can put the reference to the Table or Figure in brackets Use a variety of verbs in active and passive voice