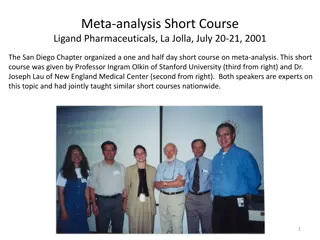
Humanitarian Aid Needs Research in Donetsk and Lugansk Regions December 2014
Explore the comprehensive research conducted in December 2014 to assess humanitarian aid requirements in Donetsk and Lugansk regions. The study encompassed quantitative and qualitative methodologies to identify key needs and aid distribution strategies, targeting the most affected communities.

Download Presentation

Please find below an Image/Link to download the presentation.
The content on the website is provided AS IS for your information and personal use only. It may not be sold, licensed, or shared on other websites without obtaining consent from the author. If you encounter any issues during the download, it is possible that the publisher has removed the file from their server.
You are allowed to download the files provided on this website for personal or commercial use, subject to the condition that they are used lawfully. All files are the property of their respective owners.
The content on the website is provided AS IS for your information and personal use only. It may not be sold, licensed, or shared on other websites without obtaining consent from the author.
E N D
Presentation Transcript
The Research of Humanitarian Aid Needs in Regions of Donetsk and Lugansk Decemder 2014
Methodology The research was conducted during December 2-16, 2014 on demand of the Rinat Akhmetov Humanitarian Center and Dopomozhemo TV . Quantitative component Telephone public inquiry Local citizens in 131/26-27 communities Qualitative component Doctors, pharmacist, taxi drivers, shop assistants, media, social networks, locals Analytical notes 26 communities 2
Quantitative Component The project estimated the humanitarian aid needs of community residents in both the Region of Donetsk and the Region of Lugansk. Inquiries were held by Kiev International Institute of Sociology (KIIS) applying the Computer Assisted Telephone Interviewing method (CATI). Respondents at the age over 18 were inquired. Sample size: 2101 respondents from 26 most needing communities were inquired in December (It was not possible to hold the inquiry in Pervomayskdue to telephone communications failure). According to the September inquiry results communities were classified, joining under one class if having similar aid needs structure (hierarchical cluster analysis method applied). Such an analysis made it possible to distinguish a group of communities, the residents of which are in the most aid need, and focus the further needs research on those particularly. In the inquiries, held from October to December, the current resident needs in foodstuff, medical supplies and non-grocery goods were investigated, as well as the work of medical and educational facilities, communications status. 3
Qualitative Component Analytical notes on each of the communities were prepared basing on combination of several data collection methods, applied in Sociology: Ethnomethodology method a behaviour research through empirical observation of daily routines. Local residents are considered to be experts, competent in their everyday experiences. Participant observation method informal collection of research-relevant data, conducted by the researcher himself (mostly notes authors were located in their research communities or quickly conveyed the information to Kyiv). Expert interview obtaining a unique expert information from the professionals in research-relevant areas medicine (doctors, apothecary pharmacist), transportation (operators), humanitarian aid (government and Territorial Social Services Centres employees). Key informant method obtaining a unique information from those possessing the knowledge of current situation (taxi drivers, shop assistants and market salesmen) + information from local media. Social networks monitoring obtaining a unique information from the on-line content, generated by residents in communities of social network VKontakte. 4
Real-life Situation Estimation In the past month the number of people, estimating the situation as unbearable ( not possible to bear our misery ), has increased by 7% Which of the statements is most relevant to current situation? 54 November 48 December 43 36 6 5 5 4 on , bearable Hard to tell Not so bad, you can live Life is hard, but Not possible to bear our misery 7
Situation Changes in the Community The negative estimation fall of situation changes in the community has stopped, still there is no improvement present. More than a half of the respondents consider the situation still permanently bad in December. How has the situation in you community changed over the past week? 3% 8% 35% 3% September 4% 9% 32% 3% October 16% 15% 21% 3% November 7% 18% 16% 1% Significantly worse Slightly better Significantly better Slightly worse December 25% 25% 8
The Main Problems of Community Security(1) The Problems Shooting, bombing in the community % of references 69 53% of respondents claim, that there are military actions held on their community territory. More than 2/3 of residents consider shooting and bombing main security problem. High crime level 11 People disappearances 6 Governmental abuse of power 4 Drug addiction 3 Persecutions on ethnic or language grounds Threats against women 1 0.3 Threats against children 0.1 Other 1 There is no problems in Security 11 Hard to tell 14 9
The Main Problems of Community Security(2) qualitative component Afraid of artillery attack. In general, crime statistics does not exceed the pre-war level. Violence against residents. Fraud practices money extortion from relatives of someone in trouble . Cases of looting and burglaries on the part of the kasaks in Pervomaysk, crime occurrence very frequent. Cases of burglary, looting, abuse, violence on the part of residents in Sverdlovsk they are doing that out of despair as the locals say. Afraid of armed men in uniform under the influence of alcohol in the communities and on the roads. 10
Basic Needs % of population lacking... November December 58 45 45 38 34 24 Household goods Medical supplies Food At average, the level of needs in household goods, medical supplies and foodstuff increased by 8%. 11
Foodstuff Needs Which of the food products are in the shortest supply in Your community? cereals 29 tinned meat and fish 26 vegetable oil fresh meat 24 18 sugar butter 16 13 milk concentrates 13 % of community residents flour 12 macaroni products fresh diary products 11 10 fish 9 root vegetable potatoes 6 bread fresh fruits confectionary baby food fresh water 5 4 4 3 1 1 other 1 12
Medical Supplies Needs Which of the medicaments are in the shortest supply in your community? Cardiac 39 For blood pressure 26 Antianxiety 20 Anti-inflammatory 9 9 Aniviral Antipyretic 9 % of community residents 7 Antitussic Insulin 7 Antiniotics 6 Vitamins 2 Antiallergic 2 Other 18 13
Household Goods Needs Which of the hygiene products and household goods are in the shortest supply in Your community? 32 Washing and cleaning products 30 , Soap, shampoo 19 Toothpaste 10 , Napkins, toilet paper 5 , Diapers, sanitary napkin % of community residents 2 , Candles, matches , Underwear, socks 1 Warn clothes 1 Heater 0 Blanket 0 Other 1 14
Communities Humanitarian Needs 47 61.7% 76.6% 66.0% 63.0% 59.4% 51.1% 63.8% 48.9% 60.1% 66.0% 51.6% 59.8% 53.2% 52.7% 51.1% 46.7% 42.6% 47.8% 48.9% 33.0% 51.1% 38.7% 48.4% 42.9% 21.9% 21,9% 57.4% 55.3% 44.7% 54.3% 56.3% 26.7% 59.6% 42.6% 47.7% 29.8% 38.7% 43.5% 31.9% 41.9% 46.8% 40.0% 34.0% 28.3% 40.0% 36.3% 40.4% 29.0% 30.1% 25.3% 18.8% 18,8% ( ) 83.0% 83.0% 80.9% 80.4% 78.1% 77.8% 76.6% 76.6% 75.8% 74.5% 74.2% 73.9% 72.3% 70.9% 70.2% 70.0% 68.1% 67.4% 66.7% 66.3% 66.0% 65.7% 64.5% 58.2% 56.3% 56,3% Needs 70,2% Medical Supplies Hygiene Products Needs 57,4% Sample size Foodstuff Needs 61,7% All (at least one need) 83,0% Zuevka 70.2% 61.7% 72.3% 69.6% 65.6% 71.1% 63.8% 55.3% 62.7% 66.0% 67.7% 63.0% 57.4% 58.6% 57.4% 63.3% 66.0% 60.9% 60.0% 53.3% 61.7% 58.7% 54.8% 52.7% 46.9% 46,9% Yasinovataya 47 47 47 46 32 45 47 47 153 47 31 92 47 203 47 92 47 46 45 300 47 300 93 30 32 32 47 76,6% 61,7% 55,3% 83,0% Novotoshkovskoe 47 66,0% 72,3% 44,7% 80,9% Komsomolskoe 46 63,0% 69,6% 54,3% 80,4% Yunokomunarovsk 32 59,4% 65,6% 56,3% 78,1% Krasnodon 45 51,1% 71,1% 26,7% 77,8% Debaltseve 47 63,8% 63,8% 59,6% 76,6% Kirovskoe 47 48,9% 55,3% 42,6% 76,6% Khartsyzk 92 59,8% 63,0% 53,3% 76,1% Stakhanov 153 60,1% 62,7% 47,7% 75,8% Gorlovka 47 66,0% 66,0% 29,8% 74,5% Svetlodarsk 31 51,6% 67,7% 38,7% 74,2% Zugres 92 59,8% 63,0% 43,5% 73,9% Yenakievo 47 53,2% 57,4% 31,9% 72,3% Snizhne 203 52,7% 58,6% 41,9% 70,9% Makeevka 47 51,1% 57,4% 46,8% 70,2% Ilovaisk 30 46,7% 63,3% 40,0% 70,0% Stanytsa Luganskaya 47 42,6% 66,0% 34,0% 68,1% Dzerzhynsk 46 47,8% 60,9% 28,3% 67,4% Avdiivka 45 48,9% 60,0% 40,0% 66,7% Shakhtarsk 300 33,0% 53,3% 36,3% 66,3% Donetsk 47 51,1% 61,7% 40,4% 66,0% Dokuchaevsk 300 38,7% 58,7% 29,0% 65,7% Lugansk 93 48,4% 54,8% 30,1% 64,5% Alchevsk 91 42,9% 52,7% 25,3% 58,2% Sverdlovsk
Top-5 Most Needing Communities Foodstuff Needs Hygiene Products Needs Medical Supplies Needs 100% 100% 100% 90% 90% 90% 80% 80% 80% 70% 70% 70% 60% 60% 60% 50% 50% 50% 40% 40% 40% 30% 30% 30% 20% 20% 20% 10% 10% 10% 0% 0% 0% Zuevka Krasnodon Zugres Yasinovataya Kommunarovsk Komsomolsk Zuevka Kirovskoe Novotoshkovskoe Kommunarovsk Debaltsevo Kirovskoe Yasinovataya Novotoshkovskoe Yunkommunarovsk All (at least one need) 100% 90% There is only one community, permanently listed in the top of lacking in all of the supply categories in December that is Yunokomunarovsk 80% 70% 60% 50% 40% 30% 20% 10% 0% Komsomolsk Zuevka Yasinovataya Novotoshkovskoe Yunkommunarovsk
Awareness of Rinat Akhmetov Humanitarian Centre Activities Do You know, that at the moment Rinat Akhmetov Humanitarian Centre is providing humanitarian aid to the population of Donbas - 1% Hard to tell 1% - 67% Yes - 32% No 17
Financial Situation qualitative component The employees of the following areas get the salaries: trade, goods and passengers transportation, cash payment services. Miners and large industrial enterprises workers partially. Accumulated previously funds and money, sent by relatives, are used. Attending territories under control of Ukraine for pension registrations, or withdrawal money from from ATMs. There is Oschadbank working in Stanitsa Luganskaya, the queues are long. Payments on the territories under control of Ukrainian government are carried out. 18
Migration Rates 32% 27% 23% October November December Note: December data are given without Pervomaysk, where migration rates in November exceeded 50%.
Migration Plans Would you like to move from your community to the territory out of Donbas? Yes, I would like to, but I can t , , 15% No 82% Yes, I m going to leave until summer , 1% Yes, I m going to leave, but don t know when , , 1% Hard to tell 1% 20
The Work of Community Services, Medical and Educational Facilities Central gas supply 1 94 3 1 Electricity supply 0 83 16 1 Hospitals 8 83 8 1 Public transport 8 77 13 2 1 Water supply 0 76 21 3 1 3 73 21 2 1 Apothecaries Inter-city transport 25 55 14 4 1 Schools 14 66 11 3 6 Hard to tell Works as usual Sometimes works Often doesn t work Doesn t work at all 21
Heating Availability (1) 79% of respondents are in possession of central heating and it is functional. Only among 1% of respondents central heating is non-functional. Every fifth family is not in possession of central heating, using the individual one. of individual heating consumers use gas, 13% electricity, 12% coal. Other kinds of heating are not spread. 3% of respondent families expressed their need in fuel (coal, wood, diesel fuel, pellets etc.). Mostly, that was the private sector residents of the communities like Zuevka, Krasnodon, Debaltsevo, Kirovskoe, Komsomolskoe. 22
Heating Availability (2) qualitative component In most of the flats and government institutions the heating is functional, though sometimes not sufficient, forcing the use of electric heaters. In residential blocks areas the critical need in fuel is not present. The need in fuel is present among the private sector residents, especially in small communities: urban-type settlement Dzerzhynsk,urban-type settlement Novotoshkivske, Stanitsa Luganskaya, Pervomaysk, Stakhanov (no CH, only individual), Avdiivka, Gorlovka, Debaltseve, Dokuchaevsk, Yenakievo, Ilovaysk, Snizhne, Yasinovataya. There is no central heating at all in Stanitsa Luganskaya (system defrosting). Unsufficient heating in schools and kindergardens in Debaltseve, Dokuchaevsk, Kirovskoe, Yasinovataya. 23
Stressful Situations across the Year Stressful situations % of references Experience bombing, shooting 80 Feeling helpless 57 Turn out to be without means of living 47 Experiencing severe illness of relatives 24 Experiencing severe illness, surgery 22 Loss of one's work, becoming forcedly unemployed 21 Loss of one's self-belief 20 Loss of belief in mankind, encounter with meanness 16 Experiencing death of relatives 12 Serious conflicts with others 5 Exposure to threats, intimidation 3 Being a victim of abuse or robbery 2 Being a victim of theft or fraud practices 2 Living in close to suicide state 1 Experiencing other stressful situations 47 There was no stressful situations 56 24
Mutual Aid (1) When You were getting into trouble and someone was able to help You, how often have you been helped? Over the past six months almost 60% of respondent families cooperated with other community residents to help each other coping with problems. Ukraine Donbas 31 In most cases, it was foodstuff and clothing aid (54%), psychological support (27%), help in everyday matters (buying groceries, transportation, tidying up etc.) 14%. 3% of respondents used to help with money. 29 27 20 19 19 19 14 9 5 Never Rarely Often Always Sometimes Note: National-wide data were gathered during KIIS Omnibus Research (Autumn 2014) 25
Mutual Aid (2) qualitative component Clothing and foodstuff exchange (collecting centres, communities in social networks, newspaper announcements). Collecting aids for other communities. Neighbourhood and relatives help, first of all psychological and then material. Free meals (church, private cafeterias, enterprises canteens). Company initiatives (MetinvestGroup Avdiivka Coke Plant, Yenakievo Bread-Baking Plant). In-home selling. 26
2015 Predictions Will the year 2015 be better or worse, than the year 2014? Although the current situation is distressful, half of the Donbass residents consider the year 2015 to be better, than the outgoing one, bringing them peace and improvement of economic situation. 46% 2015 for Donbass will be... 14% 52% Worse Better In 2015 the economic situation in Donbass ... 10% 47% Less peaceful More peaceful 26% improvement or less There will be no Will improve more 27
Peace and Recovery Expectations In the upper right corner (Group I) there are communities, in which more than 50% of residents consider 2015 to be the year of peace and economy improvement. In the lower right corner (Group II) there are communities, in which the residents hope for peace without economy improvement. And in the lower left corner (Group III) there are communities, in which the residents see the perspectives of peace and improvement with a great deal of pessimism. Lugansk Dzepzhynskyi Sverdlovsk Ilovaysk Snizhne Stakhanov Makeevka Zugres 50.0% Shakhtarsk Krasnodon Alchevsk Sletlodarsk The economy will improve Donetsk Yunokomunarovsk Khartsyz Novotoshkivske Stanitsa Luganskaya Zuevka Gorlovka II group Kirovskoe Yasinovataya Komsomolskoe Avdiivka Yenakievo Dokuchaevsk Debaltsevo III group There will be peace 0.0% 0.0% 50.0% 28
When will the conflict in Donbuss be over? What do You think, when the conflict in Donbuss will be over? It will happen in... 40% of respondents think, that the conflict will be over within a year 18% Couple of months 22% Next year 2-3 2-3 years 9% 4-5 4-5 years 3% 3% 5 Will last more, then 5 years 2% Never 44% I don t know 29
Long-term Perspective How will the situation in Donbuss change over the next 10 years? One way or another, Donbas will cope with all its problems and become a region with the same life level, as in other regions of Ukraine 34% It is doubtful, that Donbas will be able to recover from the military conflict and will be a region with low life level 11% After all, Donbas will become a region of economic prosperity 21% Hard to tell 34% 30
Sentiments and Expectations qualitative component In those communities, where active military operations are not held, the residents expect peace and stability. Expect the military actions to be over. Expect financial stability. 31
Main Conclusions (1) The number of people estimating the current situation as unbearabke increased over a month from 7% to 43%. Most of all the Donbass residents are afraid of artillery attacks, 53% of respondents claim that there are military actions held on their community territory. At average, the level of needs in household goods, medical supplies and foodstuff increased by 8%. The most difficult supply and general situation is still present in Stanytsia Luhanska, Pervomaysk, Stakhanov and uts Novotoshkivske. Most of the residents (82%) does not want to leave their community, 15% more want, but are not able. 32
Main Conclusions (2) Besides receiving the humanitarian aid, people cooperate to help each other with food, clothing and psychological support. Although the current situation is distressful, half of the Donbass residents consider the year 2015 to be better, than the outgoing one, bringing them peace and improvement of economic situation, and 40% of residents think, that the conflict will be over within a year. 33
Thank You for Your attention! paniotto@kmis.kiev.ua nkh@kiis.com.ua d.pyrogova@kiis.com.ua


")
")

")
 qualitative component")


")
")