Hurricane Harvey Research Insights on Media Usage During the Weather Emergency
"Explore key findings from a survey conducted during Hurricane Harvey, revealing insights on news media habits, most trusted sources, and time spent consuming information. Discover how local TV news emerged as a primary source for updates. Gain valuable data on media consumption during emergencies." (495 characters)

Uploaded on | 1 Views
Download Presentation

Please find below an Image/Link to download the presentation.
The content on the website is provided AS IS for your information and personal use only. It may not be sold, licensed, or shared on other websites without obtaining consent from the author. If you encounter any issues during the download, it is possible that the publisher has removed the file from their server.
You are allowed to download the files provided on this website for personal or commercial use, subject to the condition that they are used lawfully. All files are the property of their respective owners.
The content on the website is provided AS IS for your information and personal use only. It may not be sold, licensed, or shared on other websites without obtaining consent from the author.
E N D
Presentation Transcript
Weather Emergency Survey Hurricane Harvey
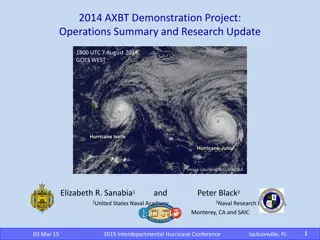
Hurricane Harvey Around 10pm Texas time, on August 25, 2017, the hurricane made landfall at peak intensity in Rockport, Texas as a category 4 hurricane. After striking land, the storm moved over the Copano Bay and made a second landfall in Texas just north of Holiday Beach at 1am CDT on August 26 as a Category 3 hurricane. Afterwards, rapid weakening ensued as its speed slowed dramatically to a crawl. It was deemed a tropical storm at 1 pm CDT on August 26. TVB engaged Research Now to conduct a survey on news media usage concerning Hurricane Harvey August 24th-26th. 2 Source: Hurricane timeline: Wikipedia
Research Overview: Methodology WHO: 724 interviews were collected via opt-in sample. To qualify respondents needed to be age 18+ and: Reside in either Corpus Christi or Houston, Texas. Had seen or heard any information or coverage of Hurricane Harvey on any media platform. Had to be in their own home and have electricity at the time of the survey (about 5% were not). WHEN: Interviews took place Thursday evening, August 24th, 2017 and ended August 26th, 2017 at midnight. WHAT: A short online survey about respondents news media habits regarding Hurricane Harvey in those two markets. Respondents were asked about their media usage the previous day. 3 Source: Research Now Hurricane Harvey Survey. 8/24/17 Evening-8/26/17 12AM Adults 18+.
Local TV News Tops For Hurricane Harvey Information Which of these sources did you watch, listen to or go to for information about the approaching dangerous weather? 89% 45% 44% 42% 40% 29% 27% 20% 18% 15% 11% 9% 5% Local TV News Program Local TV Station's Website National TV News Program Social Media Radio Cable News Network Newspapers All Other Internet Use on the Computer Cable News Channel's Website Digital Version of a Newspaper Website Broadcast TV Network's Website Online News Aggregator or Blog Website Radio Website 4 Source: Research Now Hurricane Harvey Survey. 8/24/17 Evening-8/26/17 12AM Adults 18+.
Most Time Spent with Local TV News Assets Daily Time Spent Yesterday A18+ (In Hours:Minutes) Local TV News 3:31 Local TV News Website/App National TV News Cable TV News Radio Broadcast 1:55 1:18 1:00 1:00 Social Media 0:59 Internet Radio Broadcast 0:54 Newspaper Other Internet 0:29 0:16 Cable News Website/App Newspaper Website/App National TV News Website/App 0:16 0:13 0:11 Blog Website Radio Website/App 0:06 0:04 5 Source: Research Now Hurricane Harvey Survey. 8/24/17 Evening-8/26/17 12AM Adults 18+.
Local TV Station News Tops For Hurricane Harvey Preparation Information When facing dangerous weather approaching your city/town/region, which source do you feel gives you the best information on how to prepare (e.g. emergency procedures, traffic information, closures)? 67% 34% 23% 22% 22% 22% 12% 11% 11% 10% 10% 8% 6% Local Broadcast Television Station News Cable News Channels Social Media Broadcast Websites or Apps of Local TV News Radio Stations Local Websites or Apps of National or Local Newspapers Websites or Apps of Cable TV News Websites or Apps of National Broadcast TV News All Other Internet News Websites or Apps of Radio Stations National Newspapers Network National News Telecasts Newspapers 6 Source: Research Now Hurricane Harvey Survey. 8/24/17 Evening-8/26/17 12AM Adults 18+.
Local TV News: #1 For Trust For each source, please indicate the extent to which you agree or disagree with the following statement: I trust the news that I see/hear on this media source 84% Top 2 Boxes 72% 68% 68% 67% 65% 59% 58% 55% 53% 50% 45% 35% Local Broadcast TV News Radio Stations Websites or Apps of Local TV News Cable News Channels Broadcast Network National News Local Websites or Apps of National or Local Newspapers Websites or Apps of National Broadcast TV News Websites or Apps of Cable TV News Websites or Apps of Radio Stations National Newspapers All Other Internet News Social Media Newspapers 7 Source: Research Now Hurricane Harvey Survey. 8/24/17 Evening-8/26/17 12AM. Top 2 Boxes: Agree strongly and Agree somewhat. Adults 18+.
Why Local TV? Information That Pertains to Their Area What are your reasons for watching local TV news during this dangerous weather time? 65% I want information that pertains to the area I live in 60% I like that they are constantly updating and giving me the latest information I feel my local station is looking out for what I need to know and will keep me safe 53% 51% I like that they visually show areas affected I want to know the status of public services e.g school closing, road conditions, public transit, shelters 50% 41% I like that they are reporting from different neighborhoods in my area 8 Source: Research Now Hurricane Harvey Survey. 8/24/17 Evening-8/26/17 12AM Adults 18+.
Why Local TV News Website/Apps? Updates and Accessibility What are your reasons for using local TV news websites/apps during this dangerous weather time? 38% I like that they are constantly updating and giving me the latest information 34% I like that I can access it wherever I am I want to know the status of public services e.g school closing, road conditions, public transit, shelters 32% 30% I trust the news from my local stations website/app 30% I like that I can get at the information I need on my timetable 28% I like getting the alerts 9 Source: Research Now Hurricane Harvey Survey. 8/24/17 Evening-8/26/17 12AM Adults 18+.
Key Points News Sources: 89% of respondents used local TV news for Hurricane Harvey information; the second choice was local TV station s websites. Time Spent: Respondents spent more time with Hurricane Harvey coverage on local television than any other source, nearly three times more than cable TV news. In the digital sphere, respondents spent almost twice the amount of time with local TV websites and apps as social media. Preparation Information: Twice as many people chose local TV for information on how to prepare for Hurricane Harvey than they did cable news. Trust: Local TV news was the most trusted source for Hurricane Harvey coverage and information. Local TV digital assets were the most trusted digital source. The top reason cited for watching local TV news during Hurricane Harvey is that respondents wanted information that pertained to their area. The top reason for using local TV news websites and apps is that they are constantly updating and giving the latest information. 10