Hydrolight and Ecolight Exercises for Marine Science Study
Dive into the world of marine science with Hydrolight and Ecolight exercises, covering topics such as inputting measured Chl(z) data, simulating water Rrs, analyzing Rrs vs. wavelength, and more. Explore the effects of mineral concentration on water properties and discover how backscatter numbers influence data output. Gain insights into optically shallow water simulations and understand the impact of depth on Klu and Kd values. Enhance your knowledge of marine environments through these hands-on exercises.

Download Presentation

Please find below an Image/Link to download the presentation.
The content on the website is provided AS IS for your information and personal use only. It may not be sold, licensed, or shared on other websites without obtaining consent from the author. If you encounter any issues during the download, it is possible that the publisher has removed the file from their server.
You are allowed to download the files provided on this website for personal or commercial use, subject to the condition that they are used lawfully. All files are the property of their respective owners.
The content on the website is provided AS IS for your information and personal use only. It may not be sold, licensed, or shared on other websites without obtaining consent from the author.
E N D
Presentation Transcript
Lab 9 Hydrolight and Ecolight exercises
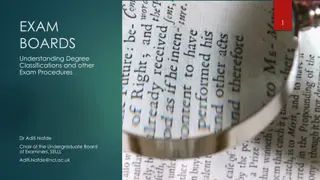
Ex. 3: simulating Case 2 water Rrs as a Function of and Mineral Concentration 1.40E-02 1.20E-02 1.00E-02 0 0.25 Rrs (1/sr) 8.00E-03 0.5 6.00E-03 1 2 4.00E-03 5 2.00E-03 10 0.00E+00 410 430 450 470 490 510 530 550 570 590 610 630 650 670 690 Wavelength ( ) Increased mineral concentration increases Rrs in the 550nm wavelengths.
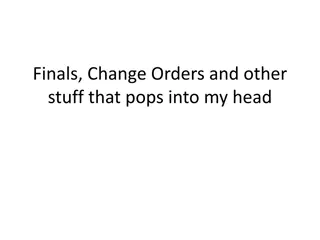
Ex. 4: simulating optically shallow water 4.50E-02 Rrs vs. Wavelength 4.00E-02 3.50E-02 3.00E-02 5m 2.50E-02 Rrs (sr-1) 10m 2.00E-02 20m 30m 1.50E-02 30m_infinite 1.00E-02 5.00E-03 0.00E+00 410 430 450 470 490 510 530 550 570 590 610 630 650 670 690 Wavelength (nm)
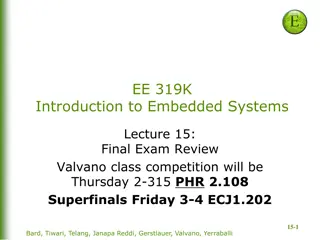
Klu (550 nm) vs. depth 6.00E-02 4.00E-02 2.00E-02 Klu_5m Klu (m-1) 0.00E+00 Klu_10m 0 5 10 15 20 25 30 -2.00E-02 Klu_20m Klu_30m -4.00E-02 -6.00E-02 -8.00E-02 Depth (m) Kd (550 nm) vs. depth 9.20E-02 9.00E-02 8.80E-02 8.60E-02 Kd (m-1) kd_5m kd_10m 8.40E-02 kd_20m 8.20E-02 Kd_30m 8.00E-02 7.80E-02 1 6 11 16 21 26 31 Depth (m)
0.15 Exercise 5 Rrs (1/Sr) 0.10 Two Hypotheses: Problems causes by wrong backscatter number or wrong data input 0.05 0.00 Backscatter changes don t appear to help drop the hydrolight curve 400 450 500 Wavelength (nm) 550 600 650 700 Editing out the anomalous data line appears to create the desired shape Original Data Edited Data (Data Removal) Original Using 0.3 Bb Original Using 0.1 Bb Original Using 0.05 Bb Edited Data (Data Removal) 3.5E-03 3.0E-03 Rrs (1/Sr) 2.5E-03 2.0E-03 1.5E-03 1.0E-03 5.0E-04 Garbage In, Garbage Out??? 0.0E+00 400 450 500 Wavelength (nm) 550 600 650 700 Edited Data (Data Removal)

 data")


 vs. depth")


![READ⚡[PDF]✔ Yup I'm Dead...Now What? The Deluxe Edition: A Guide to My Life Info](/thumb/20463/read-pdf-yup-i-m-dead-now-what-the-deluxe-edition-a-guide-to-my-life-info.jpg)