Hydrology in Design - Dr. Khayyun A. Rahi
This lecture covers various aspects of hydrology in design, focusing on IDF curves and runoff calculations for Austin. It provides insights into the rational method for determining design runoff rates based on storm frequency and intensity. Practical examples illustrate the application of volumetric methods for detention volume sizing and rooftop rainwater harvesting techniques. The content is relevant for environmental engineering and stormwater management.

Download Presentation

Please find below an Image/Link to download the presentation.
The content on the website is provided AS IS for your information and personal use only. It may not be sold, licensed, or shared on other websites without obtaining consent from the author.If you encounter any issues during the download, it is possible that the publisher has removed the file from their server.
You are allowed to download the files provided on this website for personal or commercial use, subject to the condition that they are used lawfully. All files are the property of their respective owners.
The content on the website is provided AS IS for your information and personal use only. It may not be sold, licensed, or shared on other websites without obtaining consent from the author.
E N D
Presentation Transcript
HYDROLOGY LECTURE TWELVE HYDROLOGY IN DESIGN DR. KHAYYUN A. RAHI DEPARTMENT OF ENVIRONMENTAL ENGINEERING JAN. 2ND, 2019
IDF-Curves Design precipitation for Austin 2
IDF curves for Austin = design rainfall intensity i a = i = Duration of storm t ( )c + t b = , , coefficien ts a b c Storm Frequency a b c 16 14 2-year 106.29 16.81 0.9076 2-yr 5-yr 10-yr 25-yr 50-yr 100-yr 500-yr 12 5-year 99.75 16.74 0.8327 Intensity (in/hr) 10 10-year 96.84 15.88 0.7952 8 25-year 111.07 17.23 0.7815 6 4 50-year 119.51 17.32 0.7705 2 100-year 129.03 17.83 0.7625 0 1 10 100 1000 500-year 160.57 19.64 0.7449 Duration (min) Source: City of Austin, Watershed Management Division 3
RATIONAL METHOD: EXAMPLEPROBLEM Use the rational method to find the 10-year and 50-year design runoff rates for the area shown in the figure below. Use the attached IDF curves to determine the rainfall intensity. Return period (yrs) Multiplier of runoff coefficient 2-10 1 25 1.1 50 1.2 100 1.25
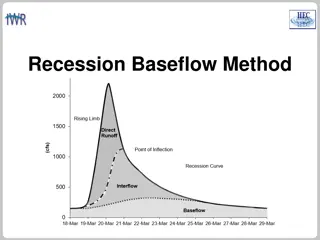
Hydrograph Volumetric Method of Detention Volume Sizing