Hydrology Lecture 2: Precipitation Forms and Measurement
"Learn about precipitation forms like rain, snow, and hail, as well as methods for measuring and estimating missing data in hydrology. Explore different techniques such as Thiessen method and isohyetal method with examples to understand how to calculate average precipitation over an area."

Download Presentation

Please find below an Image/Link to download the presentation.
The content on the website is provided AS IS for your information and personal use only. It may not be sold, licensed, or shared on other websites without obtaining consent from the author.If you encounter any issues during the download, it is possible that the publisher has removed the file from their server.
You are allowed to download the files provided on this website for personal or commercial use, subject to the condition that they are used lawfully. All files are the property of their respective owners.
The content on the website is provided AS IS for your information and personal use only. It may not be sold, licensed, or shared on other websites without obtaining consent from the author.
E N D
Presentation Transcript
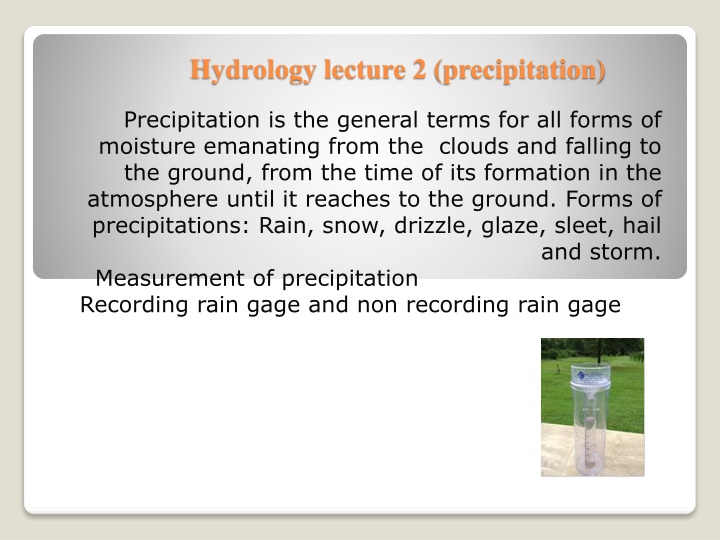
Hydrology lecture 2 (precipitation) Precipitation is the general terms for all forms of moisture emanating from the clouds and falling to the ground, from the time of its formation in the atmosphere until it reaches to the ground. Forms of precipitations: Rain, snow, drizzle, glaze, sleet, hail and storm. Measurement of precipitation Recording rain gage and non recording rain gage
Estimating of missing data When one of rain gages out of work, the missing data will obtain by the following method: Px= ( ?? ?1 mm) ) P: daily reading N: annual reading (mm) N: number of stations ?+ ?1 + ?2 +..........) ?2
Example Example.1-The normal annual (A,B,C,D (125,102,76,118,137)cm recorded for stations (A,B,C,&D) are (13.2,9.2,6.8, &10.2)cm ,estimate the missing data @ sta. E? P of five stations respectively storm the &E)are during a P ?
Px= ?? ?(?1 3(13.2 ?2 ?2+ ?3 118) = 12.72 cm ?3) ?1+ =137 125+ 9.2 102+10.2 Average precipitation over an area: 1-Simple arithmetic mean This method is used for a flat ,wide and little number of gages Pav.=(p1+p2+p3+ +pn)/n
Thiessen method This method is used at a flat( or nearly),uniform distribution and the area takes a geometrical shape ----------------------- Pav.= ?1 ?1 ?? ?? How to use thiessen : 1-draw lines connect each two Points (black line), then draw a normal and mid line for each previous lines (blue ). + ?2 ?2
Isohyetal method Pav.= Pav.= average precipitation P1, p2,-------=gage reading for each station A1= area between first and second contour line (km)2. At= total area Km2 ?1+?2 ?1 ?? ?2 ?? +?2+?3 2 2
Example.1-Asquare area of 100 km is gauged by three rainfall gauges @ 2.5 km from sides (fig.)(on si estimate the average precipitation? Sta. P(mm) 1 106 152 127 2 3
A1=square +triangular =5*5+0.5*5*5 =37.5 km =A3 A2=5*5 =25 km At=10 *10 = 100 km Pav.=(p1(A1)+P2(A2) +P3(A3)) /At =( 106*37.5+25*152+127*37.5)/100 =125.4 mm
Example.2 Isohyets drawn for a storm gave the following data P(cm) 15-12 12-9 9-6 6-3 3-1 Area(km2) 92 128 120 175 85 Estimate the average precipitation over the catchment? Pav.=(( * 92) + ( * 128) + ( * 120) + ( * 175) + ( * 85)) / 600= 7.4 cm
Example 3-Acircle shaped area of 50 km radius gauges fixed @ the points 1,2,3,4 &5 with data below ,compute the value of average P, by thiessen s method ? Sta. 1 2 3 4 5 P(cm) 3.2 4.8 5.4 6 4.5 Total area = 50 * = 7580 km A5=50 *50 =2500 km A1=A2=A3=A4=(7850 2500)/4=1337.5 km Pav.=(A1P1+A2P2+A3P3+A4P4+A5P 5)/AT =2500*4.5 +(1337.5(3.2+4.8+5.4+6))/7850 =3.4 cm
")