Dive into the world of hypothesis testing in inferential statistics, where descriptive statistics fall short. Learn the difference between a hypothesis and hypothesis testing, the steps involved, and the significance of p-values and confidence intervals in testing relationships and variations between variables. Explore how hypothesis testing allows researchers to move beyond simple data descriptions to draw meaningful conclusions and make informed decisions based on empirical evidence.
Please find below an Image/Link to download the presentation.
The content on the website is provided AS IS for your information and personal use only. It may not be sold, licensed, or shared on other websites without obtaining consent from the author. If you encounter any issues during the download, it is possible that the publisher has removed the file from their server.
You are allowed to download the files provided on this website for personal or commercial use, subject to the condition that they are used lawfully. All files are the property of their respective owners.
The content on the website is provided AS IS for your information and personal use only. It may not be sold, licensed, or shared on other websites without obtaining consent from the author.
As stated earlier, descriptive statistics is used to describe a set of data in terms of its frequency, central tendency, and dispersion. Although the description of data is important and fundamental to any analysis, it is not sufficient to answer many of the most interesting problems that researchers encounter. Consider an experiment in which a researcher is interested in finding whether fertilizer application improves crop production.
Descriptive statistics will not tell the researcher, whether the difference between the means is significant or not. To address these issues, the researcher must move beyond descriptive statistics and into the realm of inferential statistics, The basic aim of inferential statistics is to test hypothesis whether the relations/differences are significant or not .
Activity 1 1. What is the difference between hypothesis and hypothesis testing? 2. What are the steps in hypothesis testing?
Definition 1: A hypothesis is an assumption or claim about some characteristic of a population, which we should be able to accept or reject on the basis of empirical evidence. Definition 2: Hypothesis testing is a process for choosing between different alternatives. The alternatives have to be mutually exclusive and exhaustive. Being mutually exclusive means when one is true the other is false and vice-versa. Being exhaustive means that there should not be any possibility of any other relationship between the parameters.
Hypothesis testing continued Hypothesis testing is commonly about examining relationships or variations between variables In hypothesis testing we are always interested in the question, Can I generalize my findings from my sample to the general population? If you run a test in SPSS and if the p-value is 0.05, then the sample can generalize the population. This means that the sample has a relation to the population
Types of Hypotheses Hypothesis is untested statement. a statement of proposition/suggestion to be tested after data is collected in the field. Well, for example, we found out that application of fertilizer increased crop production. Is the relation statistically significant? Hypothesis testing answers this kind of question. We start by converting the question into two hypotheses: 1. Null hypothesis (H0) - There is no difference--------------- 2. Alternative hypothesis (H1)- There is a difference------------
Outcomes There are two possible outcomes of hypothesis testing: Reject H0 in favor of H1 - Suggests that the alternative hypothesis is accepted Do not reject H0 -Suggests that there is not sufficient evidence to reject H0and hence H0 is accepted
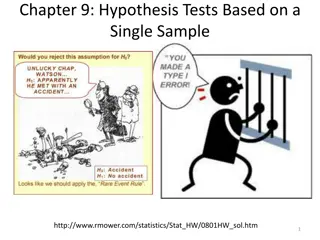
Type of Errors There are two types of errors that may occur in hypothesis testing: Type I error occurs when the null hypothesis is rejected although it is true, Type II error occurs when the null hypothesis is not rejected although it is false. If we concluded that there is a difference in the intelligence between cats and dogs but in actual conditions not (Type I error). if we concluded that there is no difference in intelligence between cats and dogs in fact there is a difference (type II error).
The P- values- The statistical power of test Conducting the P-value in statistical software such as SPSS/STATA is very simple. These tests give us a probability value (p-value) This helps us to decide whether or not the H0 should be rejected or accepted.
Using the p-value to make this decision, it must first be decided what probability value we find acceptable This is often referred to the significance level If the p-value is below this level, it means that we can reject the H0in favor of the alternative hypothesis, if the p-value is above this level, it means that we accept the H0 The smaller the p-value, the more convincing to reject the H0
P-value can take any value between 0 and 1 Values close to 0 (0.001, 0.005, 0.045..) indicate that the observed difference is unlikely to be due to chance and it is significant, hence H0is rejected whereas a P value close to 1 (0.09, 0.08 ) suggests no difference between the groups and hence no significant difference, hence, H0is accepted. Thus, it is common to see adjectives such as highly significant or less significant depending on how the P-value is closer or far away from zero.
Size of sample: The larger the sample the more likely a difference to be detected and likely to be significant. Spread of the data: The bigger the standard deviation, the more the spread of observations and the higher the P value and less significant.
ACTIVITY 2 1. What knowledge do you have in relation with Significance Level? 2. What Relation Does It Has to the P-values? 3. How Many Significance Levels So Far You Know?
Significance test: A statistical test to investigate an hypothesis relating to differences or relationships between variables. Significance levels p<0.05 Statistically significant at the 5 % level * p<0.01 Statistically significant at the 1 % level ** p<0.001 Statistically significant at the 0.1 % level *** Q. What does 5% mean? p<0.1 statistical significance at the 10 % level is so weak, commonly used significance level in some fields of research
Let us return to our example if we find a difference in intelligence between cats and dogs, and the p-value is less than 0.05 (e.g., 0.02, 0.04, 0.03, etc.) the null hypothesis (i.e. no difference) is rejected at the 5 % significance level However, the p-value does not state whether the difference is small or big In such a case, one would have to look the effect size (b/c it shows the strength of r/s between variables)
Note that The p-value is affected by the sample size, Which means that a smaller sample size often translates to a larger p-value For example, if you have a sample of 100 individuals (much > 30) the effect size has to be quite large- large differences translates into small p-values and hence significant That is, larger sample size makes it easier to find small p-values For example, if you take the entire population of a country, a tiny differences are likely to have small p-values This means that the size of the sample influences the chances of rejecting the null hypothesis
Population Parameter and Statistic A parameter tells us something about a population while a statistic tells us something about a sample The population parameter is thus basically a measure of any given population. Examples of population parameters - the mean age of Ethiopian men We seldom have information about the entire population, in that case, the population parameter in many cases unknown.
Limits and levels The interval has an upper and a lower limit (i.e. confidence limits). Similar to p-values, confidence intervals have confidencelevels It indicates how certain we can be that the interval includes the true population parameter Confidence intervals are typically stated at the 5 % level or 95% CI. A 95 % confidence interval would thus mean that if we replicated a certain analysis in 100 samples of the population, we would expect that 95 % of the intervals would include the true population parameter.
Activity 3 How can we associate CI, precision and sample size? Confidence and precision When discussing confidence intervals, it is important to be aware of the tension between precision and certainty: better precision means less confident interval (low range) logically, a higher confidence level means more confidence. The higher the confidence level the wider the interval the less the precision we can made
Note that The width of the confidence interval is also affected by the sample size: The larger the sample size, the smaller the interval (better precision). Let us take an example We have gathered data on all Geography students at Haromia University and find that their mean age is 26 years. we can calculate the confidence interval at the 5% level and becomes 24-30 ( small interval) Therefore, we can conclude that: with 95% confidence, the mean age of Geography students lies in between 24 and 30 years .
Summary Confidence versus precision High confidence level wider confidence interval less precision Low confidence level smaller confidence interval more precision
CHOOSING THE RIGHT STATISTICAL TECHNIQUES When a researcher is ready to test a specific hypothesis the first job should be choosing an appropriate statistical tests. Choosing an appropriate statistical procedure is important 1. Because the statistical procedure chosen must offer a legitimate test of the hypothesis. For example, if a study hypothesizes differences in mean scores between groups, it will make no sense for the researcher to choose a test of relationship. 2. choosing appropriate statistical procedure helps to detect significant differences between groups
Although the researcher is faced with a multitude of statistical procedures to choose from, the choice of an appropriate statistical test is generally based on: (1) the nature of the hypothesis and (2) the levels of measurement of the variables to be tested. The Nature of Hypotheses: Test of Difference vs. Test of Relationship This means that the intention of the hypothesis to test for differences in mean scores between groups, or is it testing for relationships between pairs of variables?
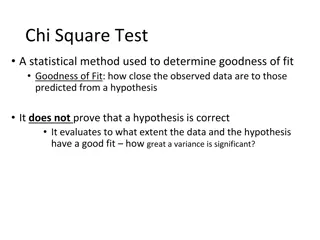
Levels of Measurement In addition to considering the nature of the hypothesis to be tested (differences or relationships), the researcher must also consider the measurements of the variables to be tested. This is because the levels at which the variables are measured determine the statistical test that is used to analyze the data Nominal variables are used for cross tabulation (Chi-square test) Ordinal variables are used for non-parametric test Continuous variables are best suited for linear regression analysis, or parametric tests
Questions raised in choosing appropriate statistical tests How is the total sample? (parametric against non parametric) Is the data categorical or continuous? Is the data collected are independent to each other or related to each other? Are you going to compare two means or more? Is your dependent variable continuous or categorical? Do you have one dependent or many dependent variables?
A good starting point in your statistical research is to choose the right statistics. For example, I am interested in Are you interested in the relationship between two variables, for example, the higher X and the higher Y? Or are you interested in comparing differences such as, X is higher for group A than it is for group B? Are you interested in predicting an outcome variable like, how does Y increase for one more unit of X?
X Y Relationships Pearson (Scale, scale) Point biserial correlation (scale, binominal) Spearman Correlation (ordinal, ordinal) Cross tab (nominal, nominal) Partial correlation (when there is intervening variables) Canonical correlation (when x and Y are multiple variables)
Analyses of Differences Start by identifying your dependent variable's level of measurement Then check assumptions for parametric tests such as T-test and ANOVA. And no assumptions for non-parametric tests such Mann Whitney wilcox sign rank , etc
Parametric tests (Analysis of differences/variances) Independent T-test Dependent/paired T-test One-way ANOVA Two Way ANOVA One-way ANCOVA One way MANOVA NOTE: in all the cases dependent variable is continuous
Why Chose to Work with SPSS? There is no question that all fields of science have come to rely heavily on the computer. This dependence has become so great that it is no longer possible to understand social science research without substantial knowledge of statistics and without at least some rudimentary understanding of statistical software.
The number and types of statistical software packages that are available continue to grow each year. In this course I have chosen to work with SPSS, or the Statistical Package for the Social Sciences. SPSS was chosen because of its popularity within circles, making it the most widely used package of its type. SPSS is also a versatile package that allows many different types of analyses, data transformations, and forms of output - in short, it will more than adequately serve our purposes.
The capability of SPSS is truly astounding. The package enables you to obtain statistics ranging from simple descriptive numbers to complex analyses of multivariate matrices. You can plot the data in histograms, scatter plots, and other ways. You can combine files, split files, and sort files. You can modify existing variables and create new ones. In short, you can do just about anything you'd ever want with a set of data using this software package.


")