Hypothesis Testing in Statistical Analysis

From a practical example of determining cost-effectiveness to exploring Type I and Type II errors, this content delves into the concepts of hypothesis testing, sampling distributions, and the Central Limit Theorem in statistical analysis. It discusses the importance of sample size, population mean, and standard deviation in making conclusions based on sample data.

Uploaded on Mar 03, 2025 | 1 Views
Download Presentation

Please find below an Image/Link to download the presentation.
The content on the website is provided AS IS for your information and personal use only. It may not be sold, licensed, or shared on other websites without obtaining consent from the author.If you encounter any issues during the download, it is possible that the publisher has removed the file from their server.
You are allowed to download the files provided on this website for personal or commercial use, subject to the condition that they are used lawfully. All files are the property of their respective owners.
The content on the website is provided AS IS for your information and personal use only. It may not be sold, licensed, or shared on other websites without obtaining consent from the author.
E N D
Presentation Transcript
distribution ? Rejection region ? ? Rejection region & p-value
Example 11.1 The manager of a department store is thinking about establishing a new billing system for the store's credit customers. She determines that the new system will be cost-effective only if the mean monthly account is more than $170. A random sample of 400 monthly accounts is drawn, for which the sample mean is $178. The manager knows that the accounts are approximately normally distributed with a standard deviation of $65. Can the manager conclude from this that the new system will be cost-effective? 11. 4
In Chapter 9, we know We can generalize the mean and variance of the sampling of two dice: The standard deviation of the sampling distribution is called the standard error: to n-dice:
Based on CLT The sampling distribution of the mean of a random sample drawn from any population is approximately normal for a sufficiently large sample size. The larger the sample size, the more closely the sampling distribution of X will resemble a normal distribution.
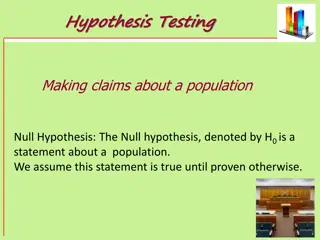
Hence, If the population mean = 170, and we keep getting a sample (size of 400) from this population, the sampling distribution follows normal distribution approximately and the mean = 170 and the standard deviation = 65/400^0.5 HT( ) ( ) ( ) Assume population mean = 170 (H0 is true) Sampling dist. follows normal with mean 170, and std 65/400^0.5 Get one sample from population Compare sample mean with sampling distribution Based on sample mean, we Reject H0 (if sample mean makes us to think the population mean is not 170) Do not reject H0 (if sample mean makes us believe population mean is 170)
Type I and Type II errors Type I error If population mean is really 170, the sampling dist. Mean = 170 and std. = 65/400^0.5 Since it follows normal, it is still likely to get a sample with an extreme (too large or too small) mean Type I error happens if we really get one sample from the population with mean =170 but since the sample mean is too large or too small, we mistakenly say that the population mean is not 170 (reject H0) Type II error If population mean is not 170, but the sample mean we get is close enough to 170 Hence, we say population mean is 170 (do not reject H0)
REJECTION REGION ? ?
The system will be cost effective if the mean account balance for all customers is greater than $170. We express this belief as our research hypothesis, that is: H1: > 170 (this is what we want to determine) Thus, our null hypothesis becomes: H0: = 170 (this specifies a single value for the parameter of interest) sampling distribution
COMPUTE Example 11.1 Rejection region It seems reasonable to reject the null hypothesis in favor of the alternative if the value of the sample mean is large relative to 170, that is if > . sample mean > 170, sample mean reject, sample mean < 170, rejection region = P(Type I error) = P( reject H0given that H0is true) = P( > ) 11. 11
REJECTION REGION & P-VALUE
Rejection region threshold point threshold point E.g. = 0.05 , threshold point175.34 P-value sampling distribution ( ) ? 175.34 p-value 0.05